

Generative art, made to plot.
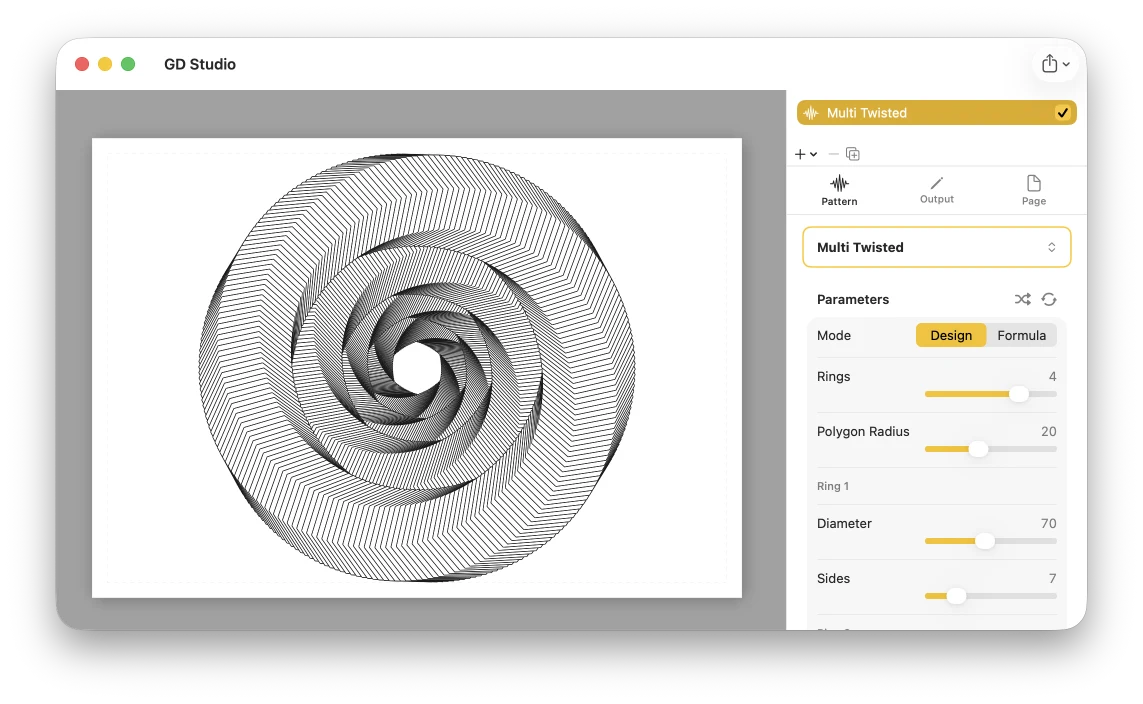
GD Studio lets you design generative artwork for pen plotters. Pick a pattern, shape it with live controls, add text or SVG elements, and export a plotter-ready file.
Requires macOS 15 or later
Who is GD Studio for?
GD Studio — short for Generative Drawing Studio — turns mathematical patterns into designs your pen plotter can draw, without writing a line of code. If you own a plotter, or you're simply drawn to the look of machine-drawn line art, it's built for you.
Generative artists and creative coders—explore parametric patterns visually, with live feedback, instead of recompiling a sketch to see a change.
Designers and makers—produce line-art posters, cards, logos, and lettering as clean vector strokes.
Educators and math enthusiasts—see curves, tilings, L-systems, and packings come to life and reshape as you change a single parameter.
Plotter-curious newcomers—start from a curated preset and tweak; no setup, no scripting, just continuous strokes that are ready to draw.
Dozens of patterns, endless variations
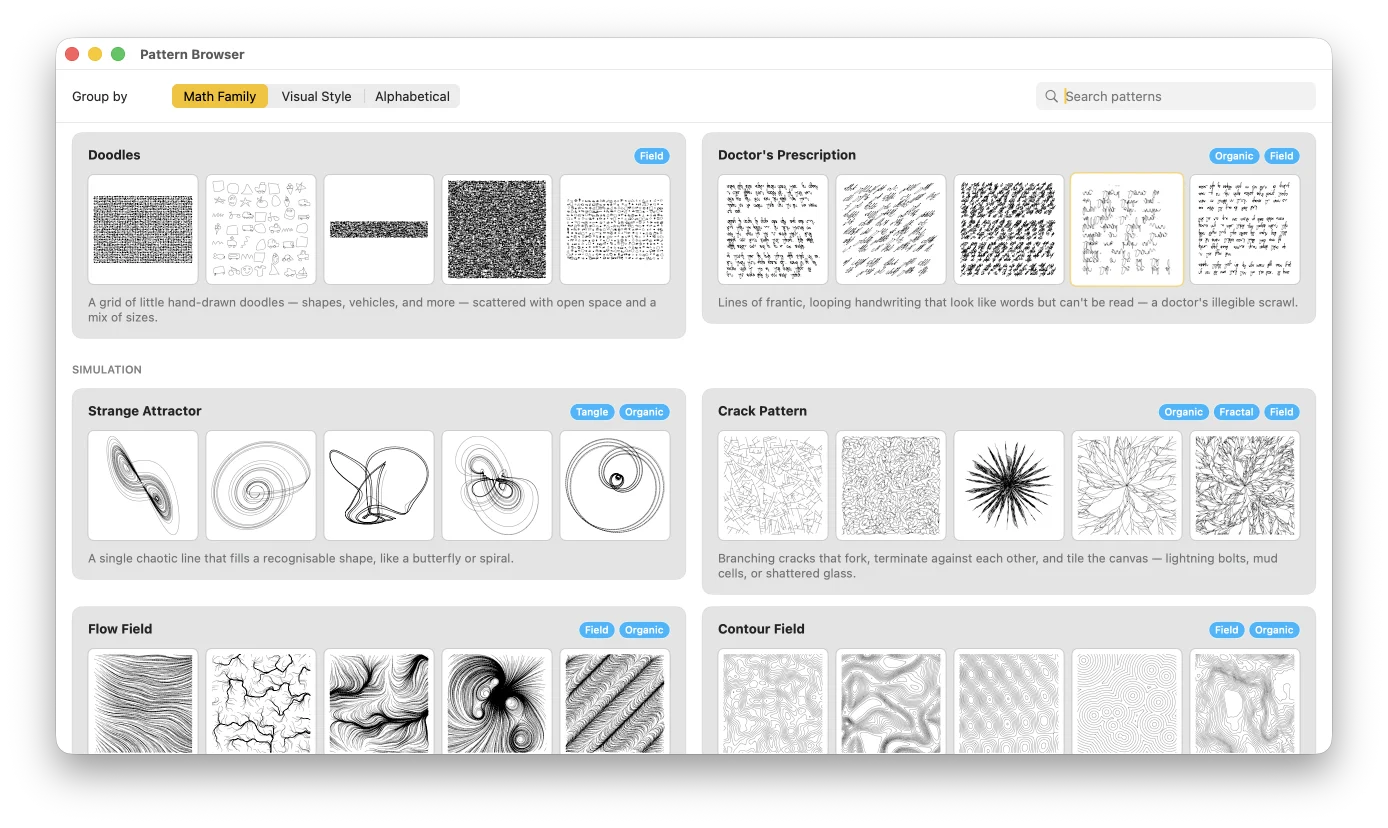
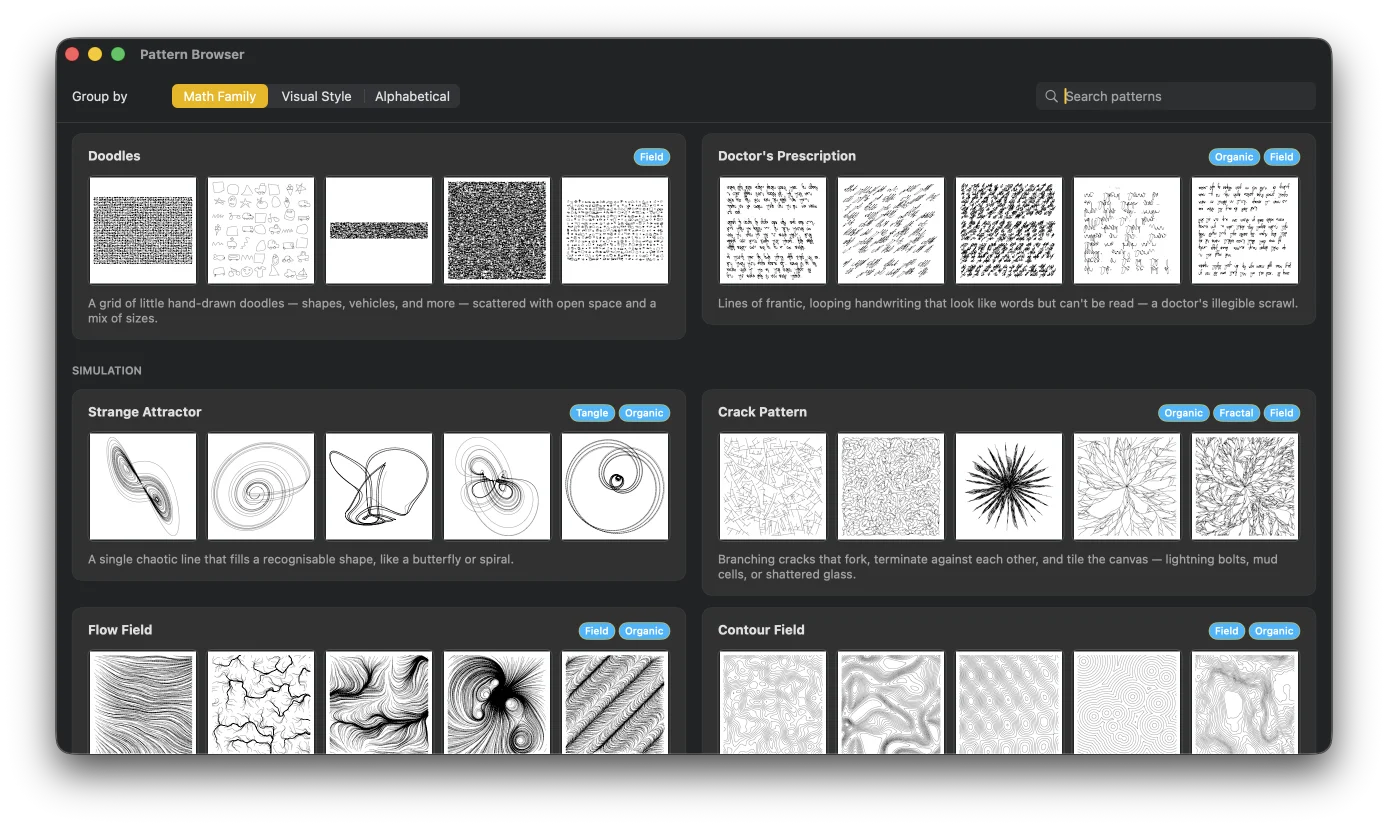
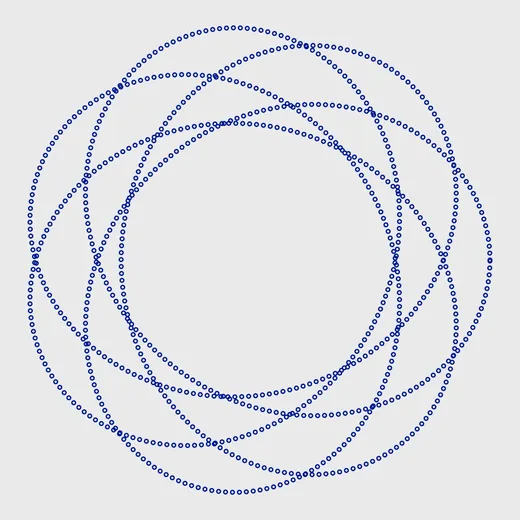
Explore 50 patterns across 8 families, from classic curves like Trochoids and Harmonographs to tilings, packings, generative systems, mazes, flow fields, and differential growth. Start from curated presets, then make each design your own: adjust its parameters, change how it is drawn, apply stroke, fill, line-style, and repeat modifiers, split it across colors, or combine multiple patterns in layered compositions. No pattern is limited to a single image. Each one is a flexible system with effectively endless variations. And because every design is built from continuous strokes, the canvas gives you a precise preview of the pen’s path: what you see is what the pen draws.
Layers, pens, and multi-pen plotting
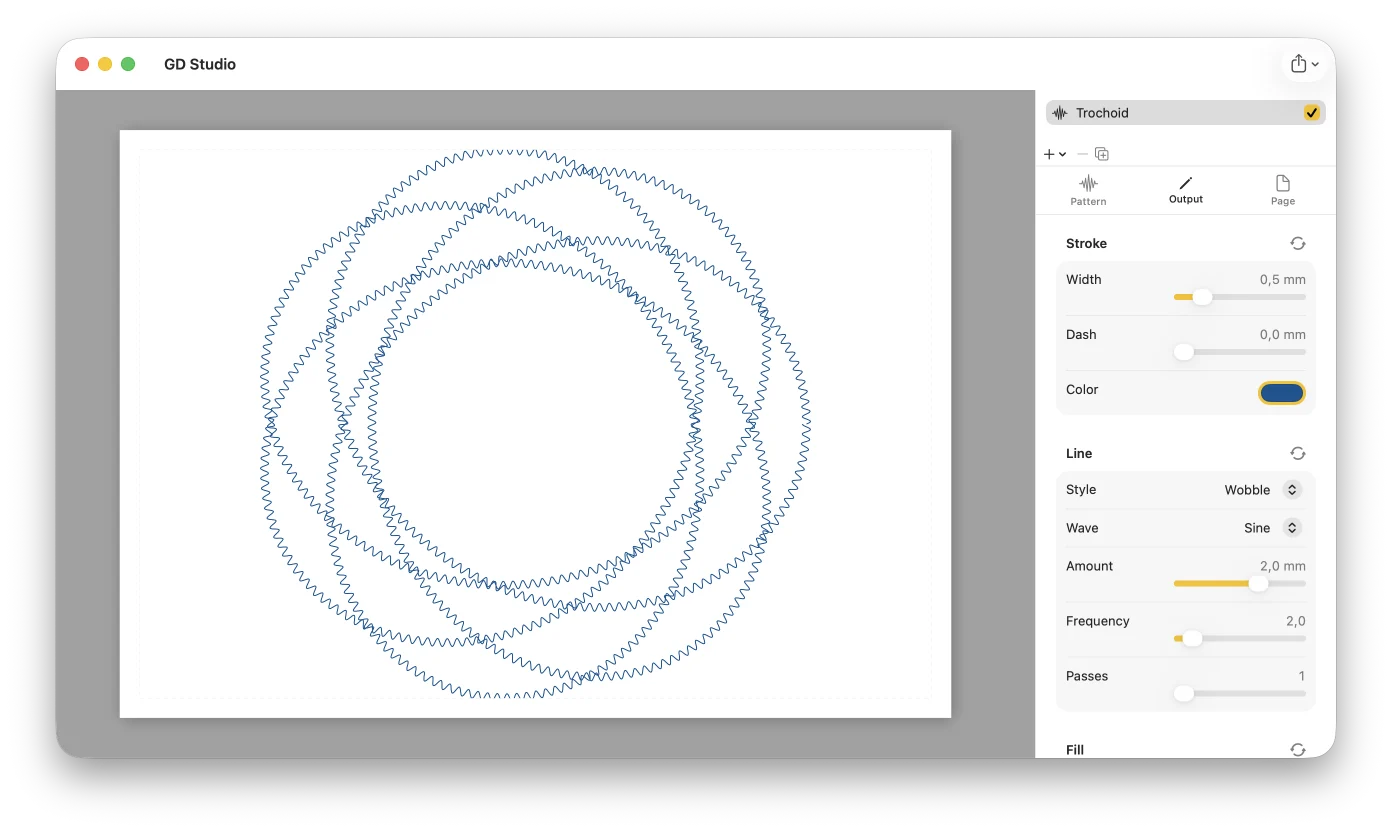
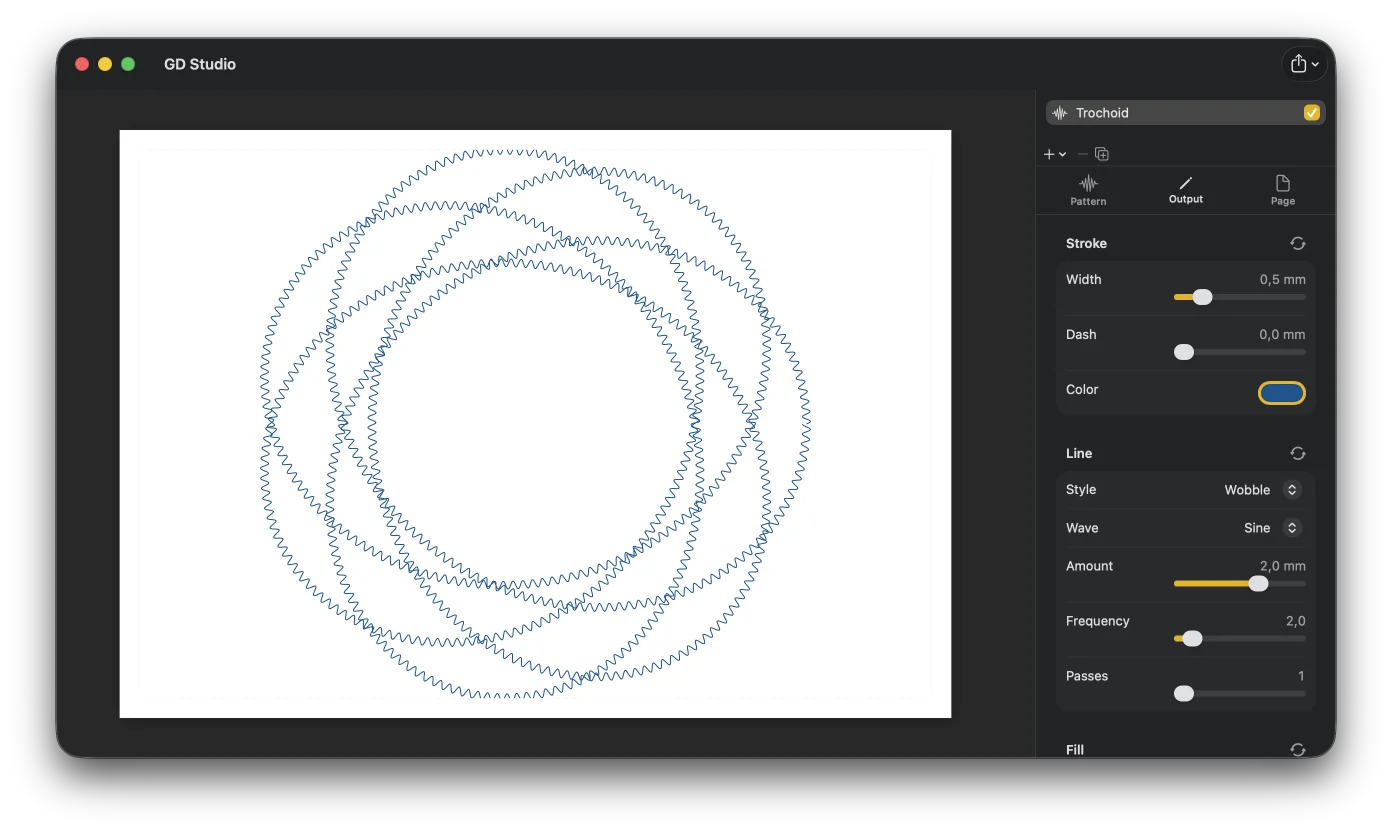
Build each drawing as a stack of layers, with independent control over pen color, stroke width, dash, transform, and render style. Restyle any line with wobble, hatch, stipple, nested outlines, and more using Line, Fill, and Repeat modifiers. Assign each pen to its own layer, or split a single pattern across several pens by path length, tile orientation, spiral arm, contour level, and other pattern-specific properties. Each layer exports as its own labeled SVG group, making it easy for plotter tools to guide pen changes between groups.
More than patterns: map, 3D model, image, text, SVG, and calibration layers
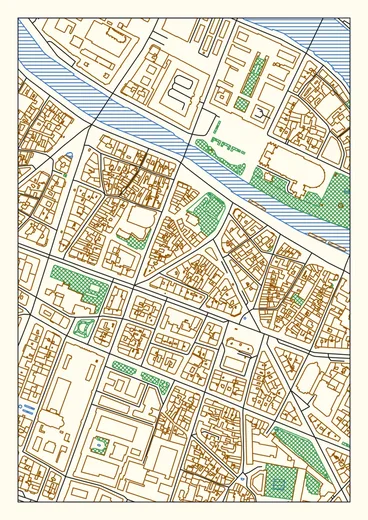
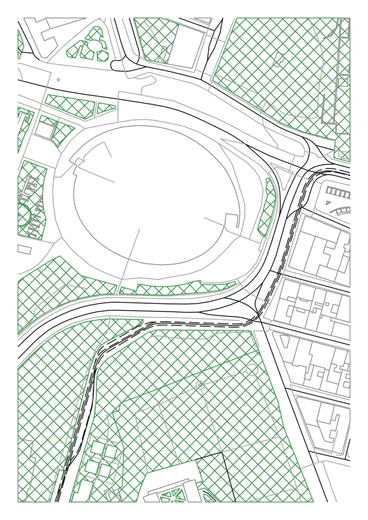
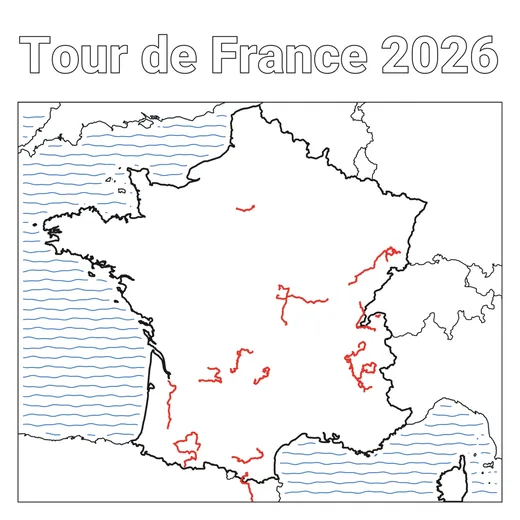
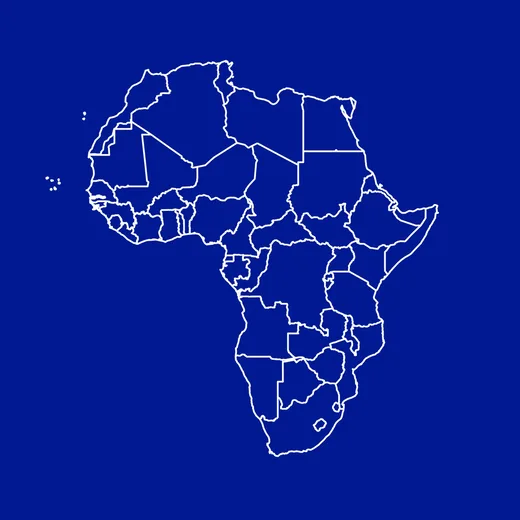
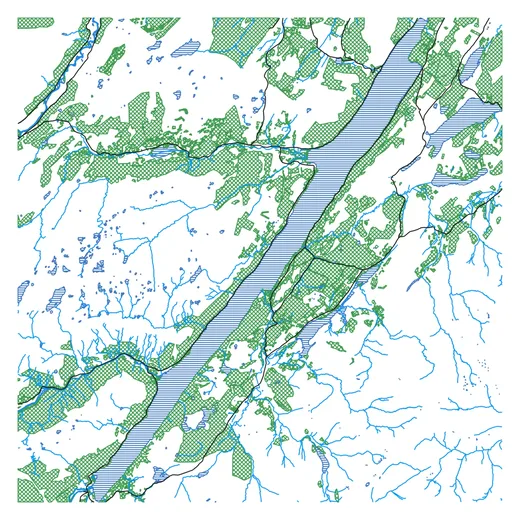
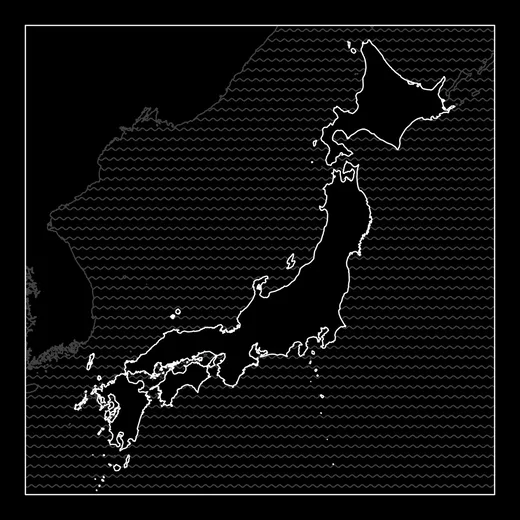
A layer doesn't have to be a pattern. Search for a place and a Map layer draws it as plottable line art — street-level detail for a city, or coastlines and borders for a country, continent, or the whole world, with every feature its own toggle, your own GPX routes drawn on top, and a split by feature for multi-pen plots.
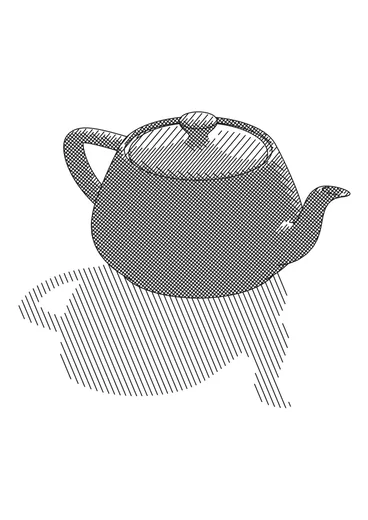
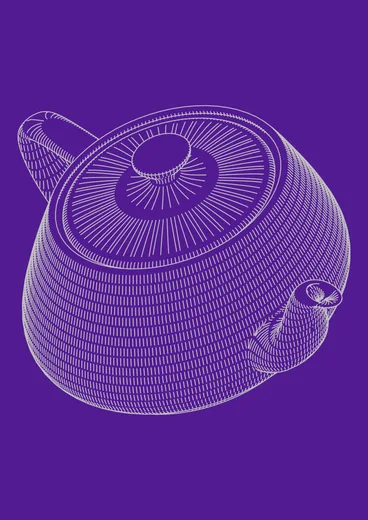
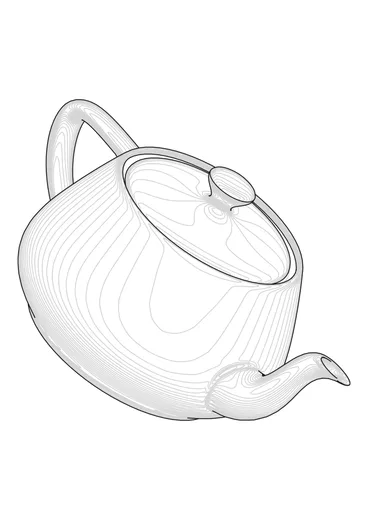
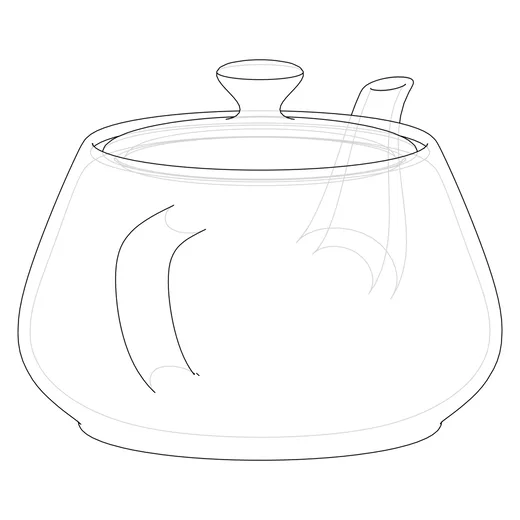
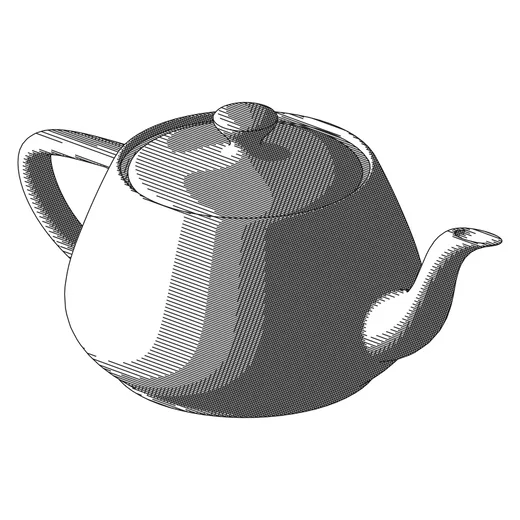
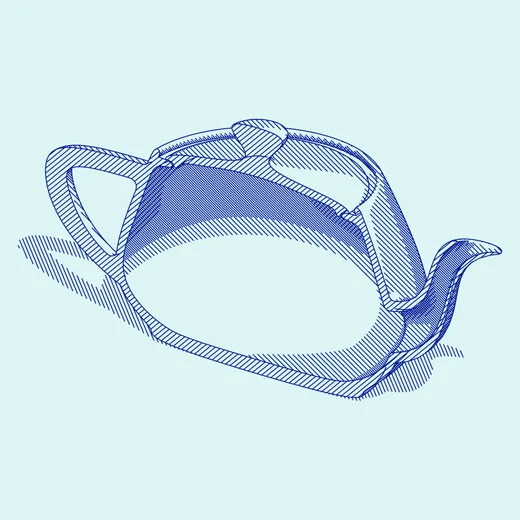
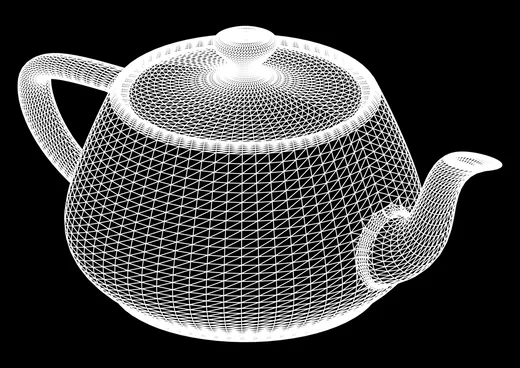
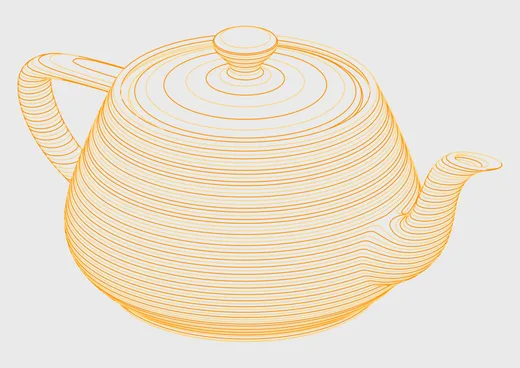
Import an OBJ, STL, or PLY mesh and a 3D Model layer draws it as plottable line art — aim the camera anywhere around the object, choose how much of the geometry the pen sees, fill the surface with engraving-inspired shading, and split the result across pens for multi-pen plots.
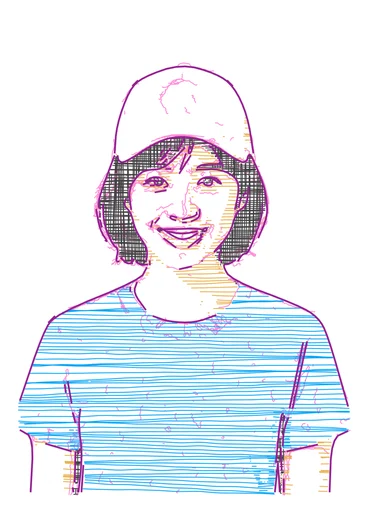
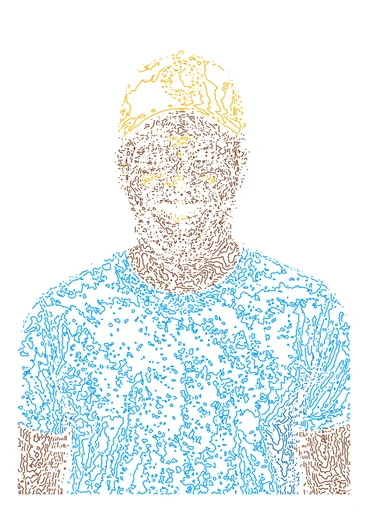
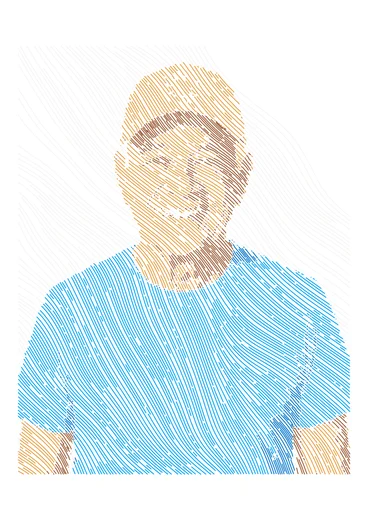
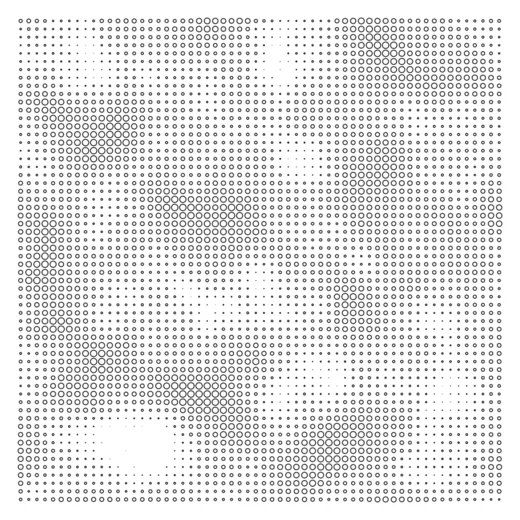
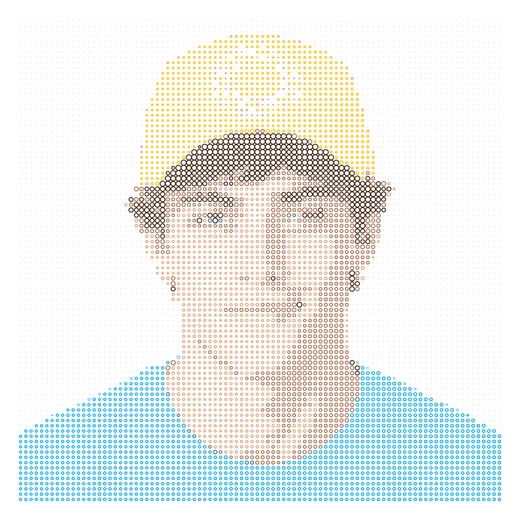
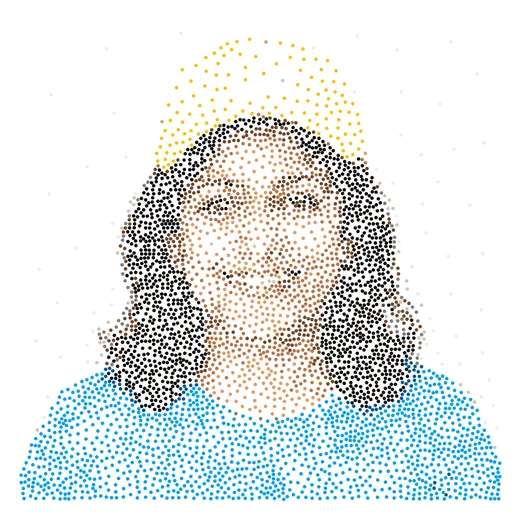
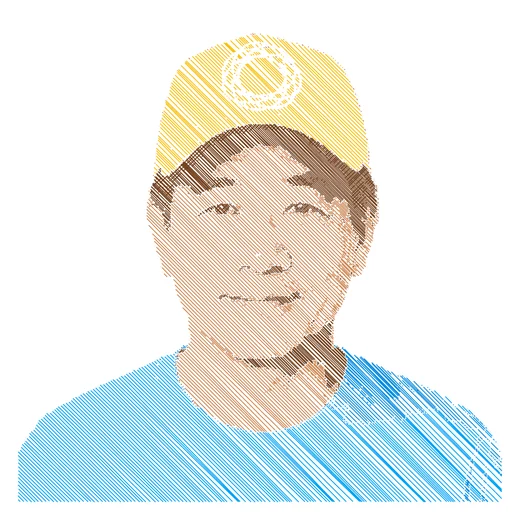
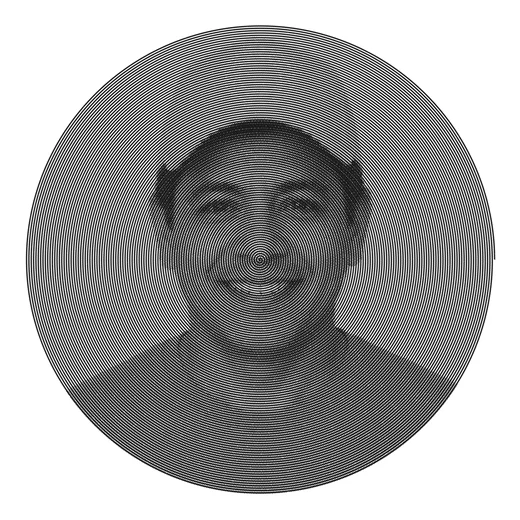
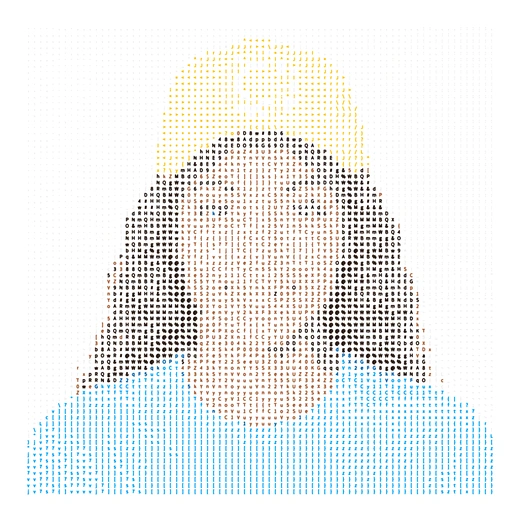
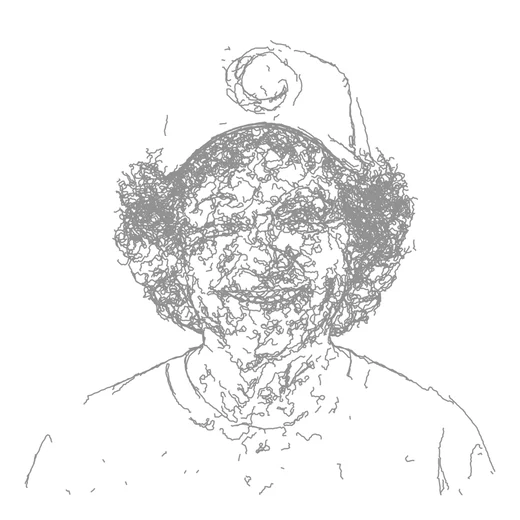
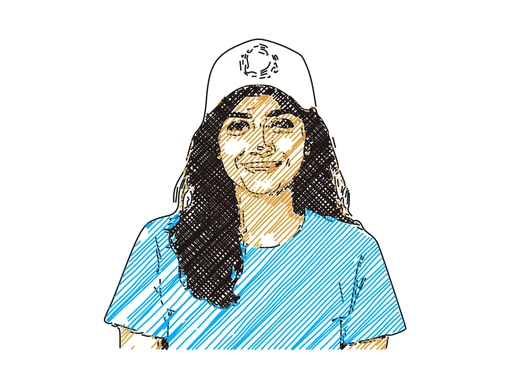
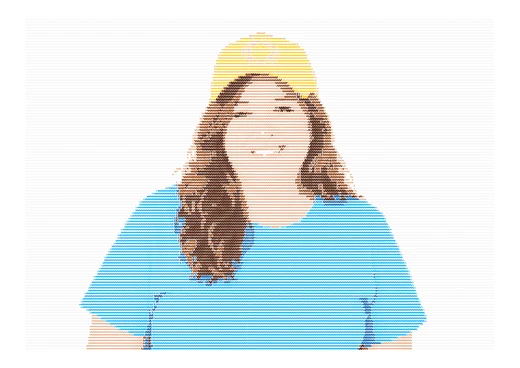
Drop in a photo and an Image layer redraws it as plottable line art — rebuilt from continuous pen strokes and single pen-taps, never a flat ink fill, with eight styles from a delicate stipple to flowing hatch to topographic contour to ASCII, plus an optional color split for multi-pen plots.
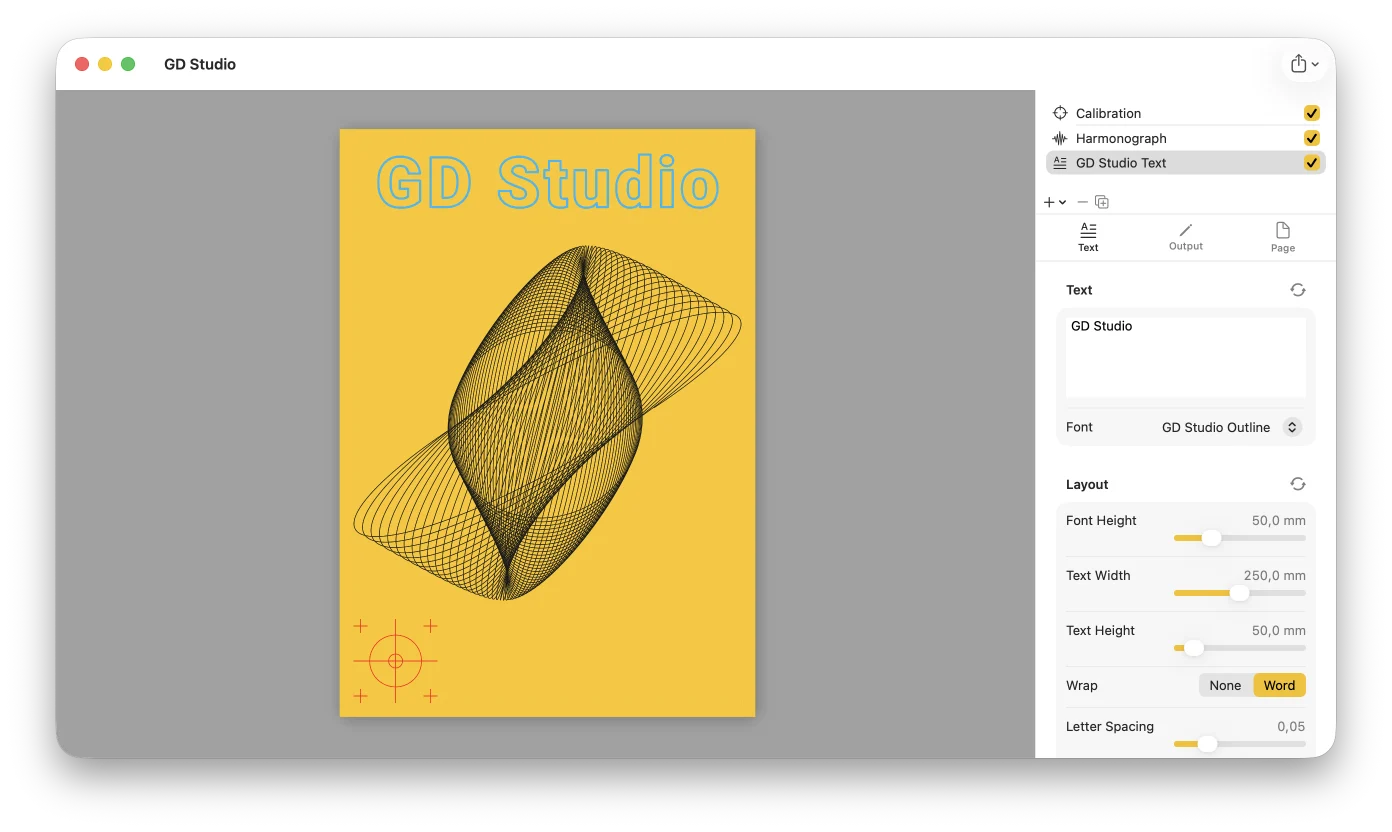
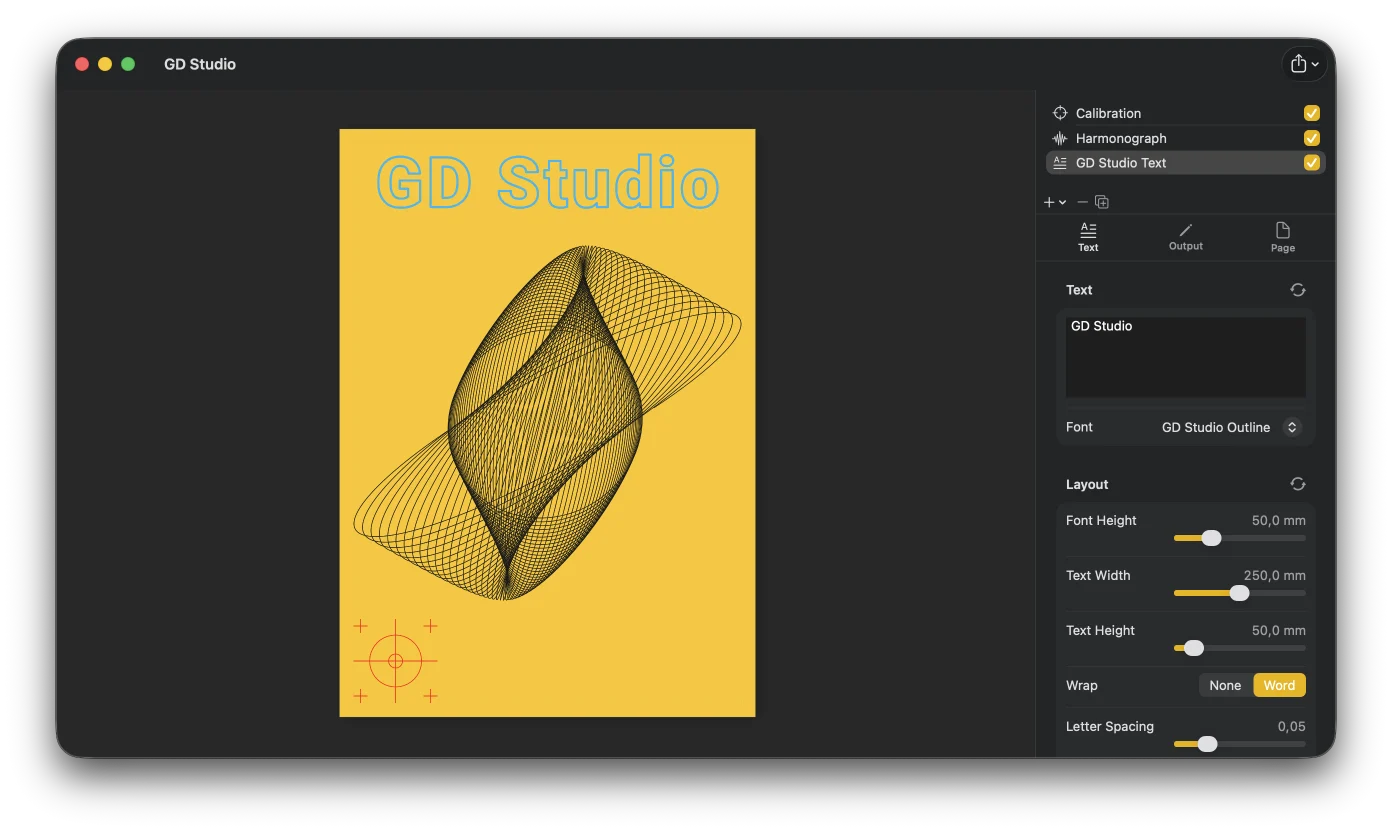
Add text rendered as real plotter strokes (single-stroke and outline fonts, plus your own custom SVG fonts), import an SVG file to bring existing line art into your design, or drop in a calibration layer — a crosshair for pen registration. Imported SVG and text become regular layers: give them any pen, restyle their lines with the same Line, Fill, and Repeat options, mask them, and transform them like anything else.
From canvas to pen on paper
Export to SVG (Inkscape / axicli layer-group convention), PDF, or print directly — each pen layer is written as its own labeled group, ready for any SVG-capable plotter workflow.
Or skip the file step entirely and plot straight from GD Studio with Plotter Hub: a free, open-source app you can install on a Raspberry Pi Zero 2 W or 3B+ to run an AxiDraw-compatible plotter over WiFi instead of USB. Plotter Hub optimizes the SVG before plotting and automatically pauses between layers so you can change pens for each color.
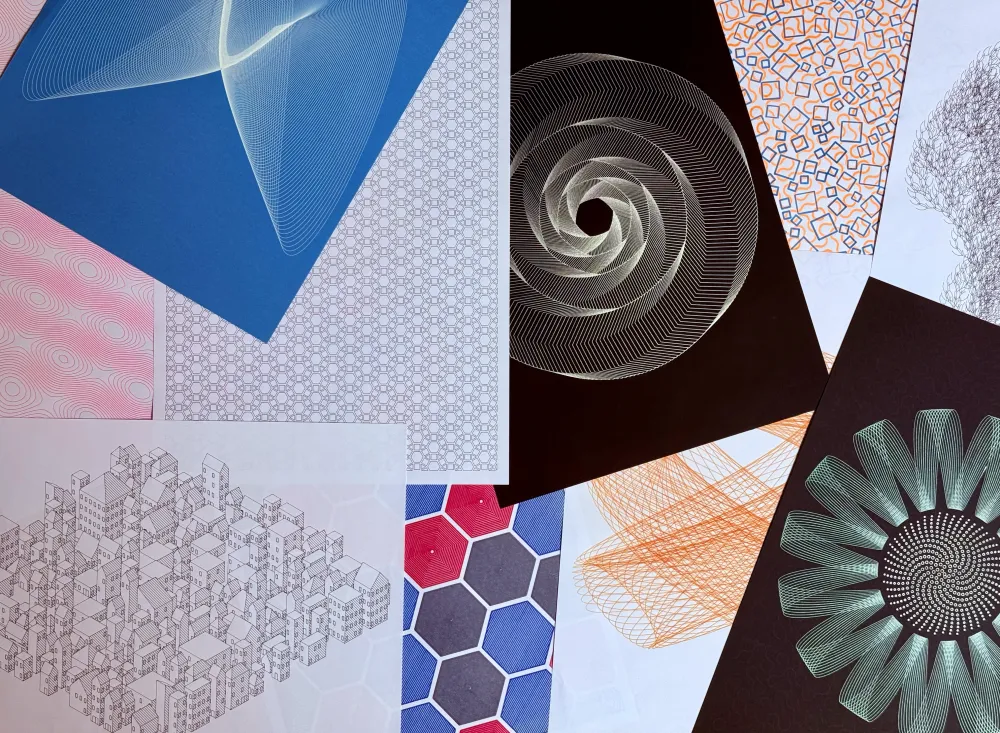
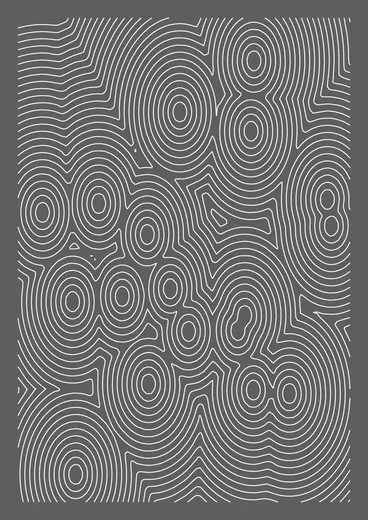
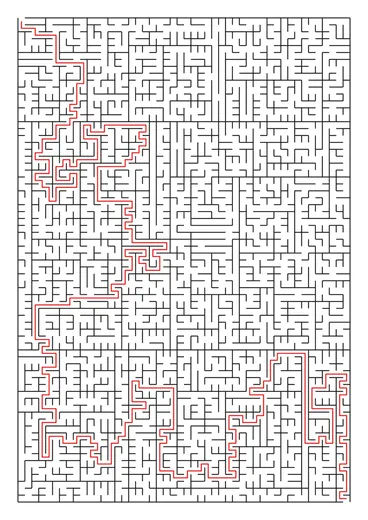
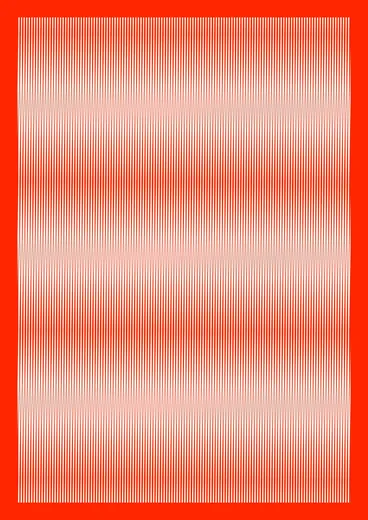
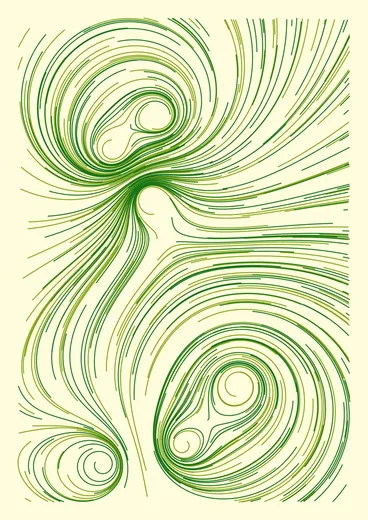
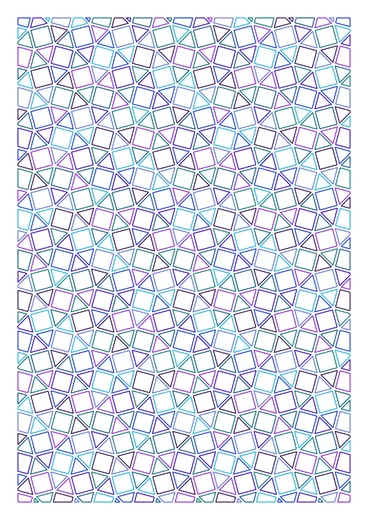
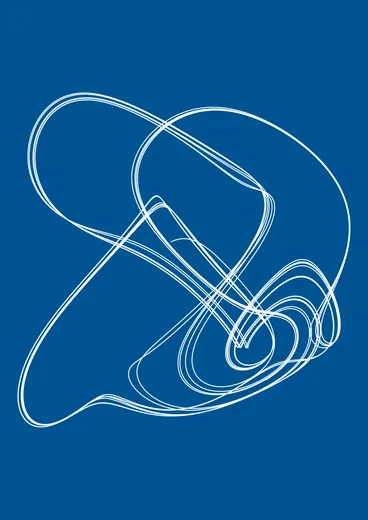
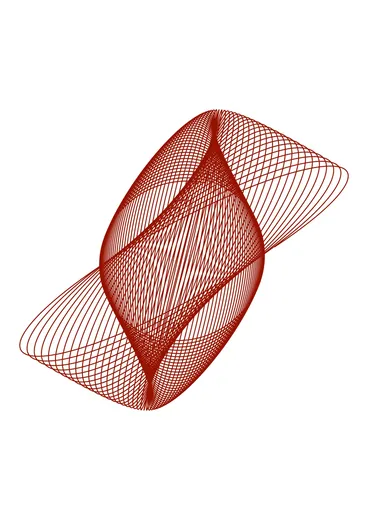
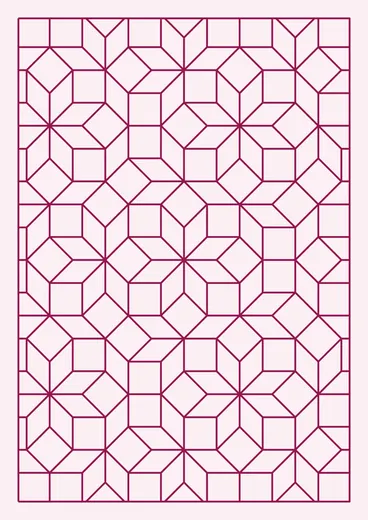
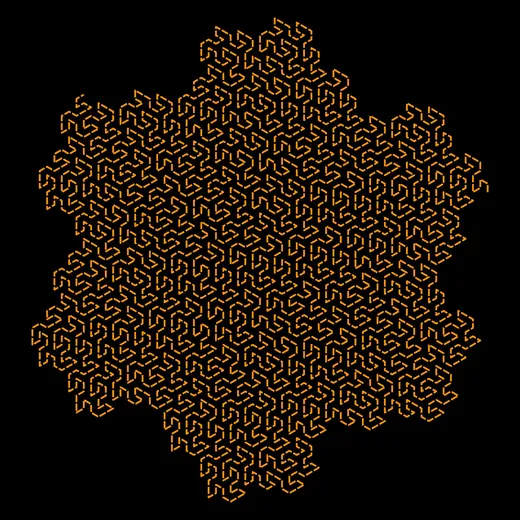
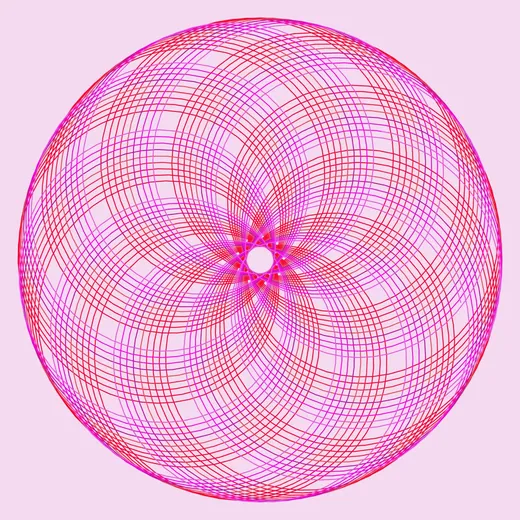
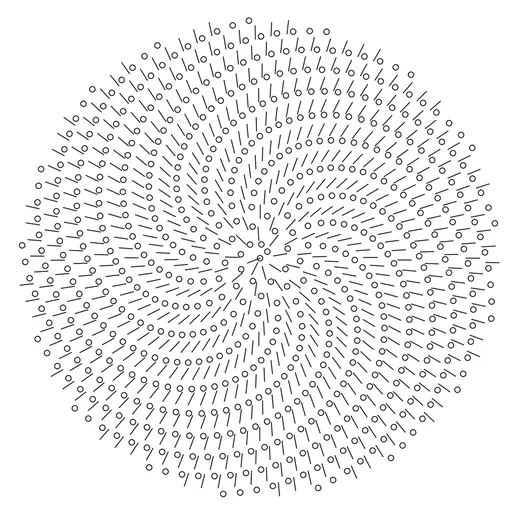
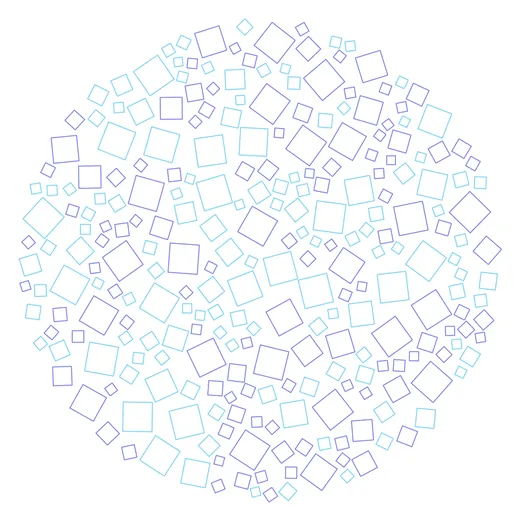
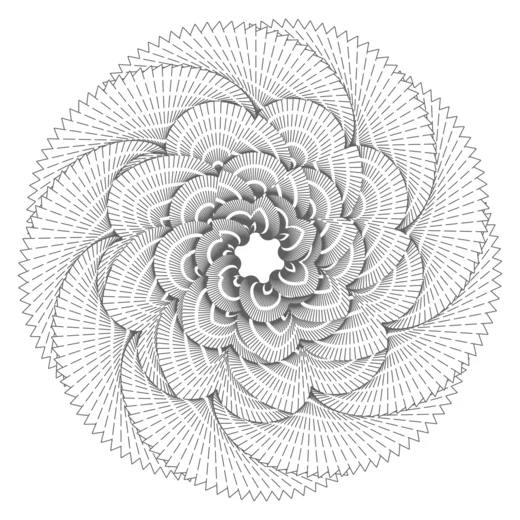
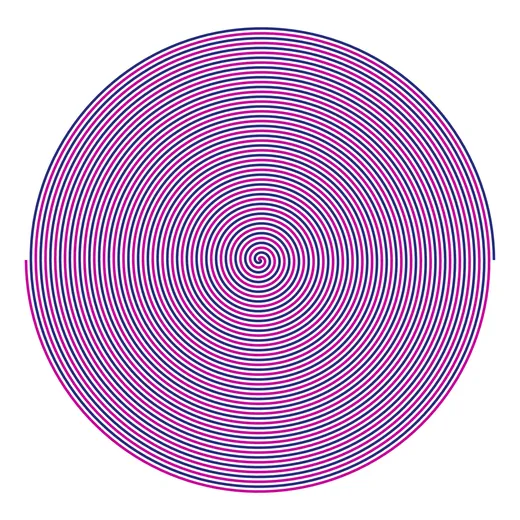
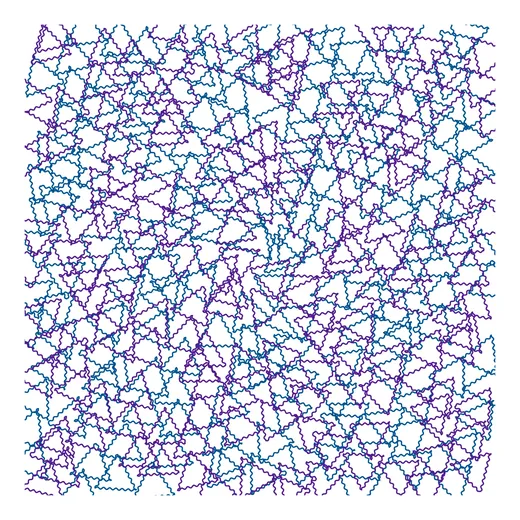
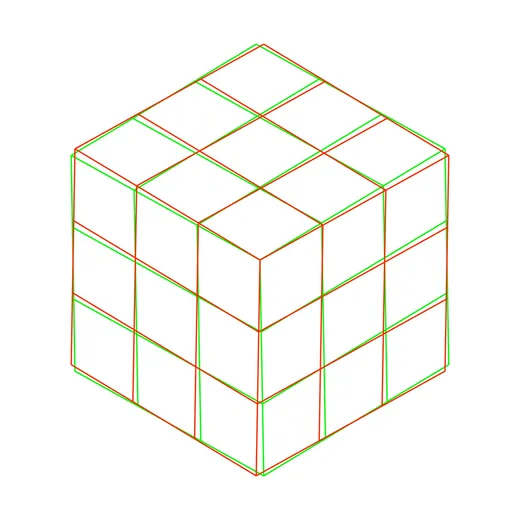
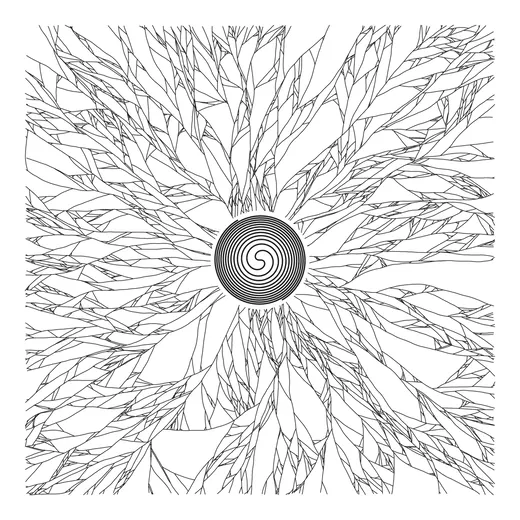
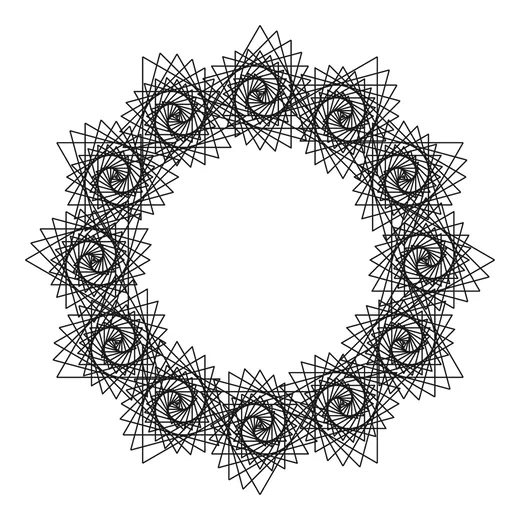
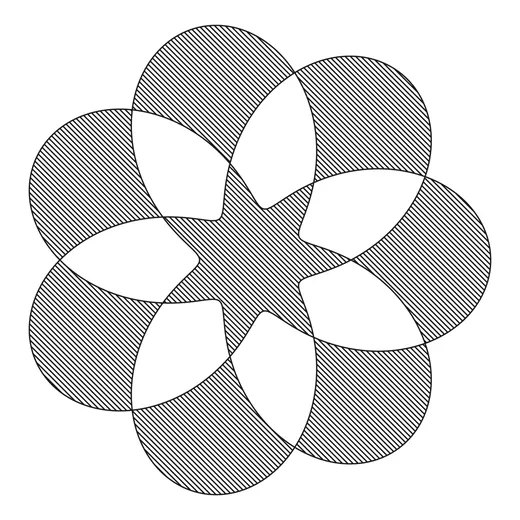
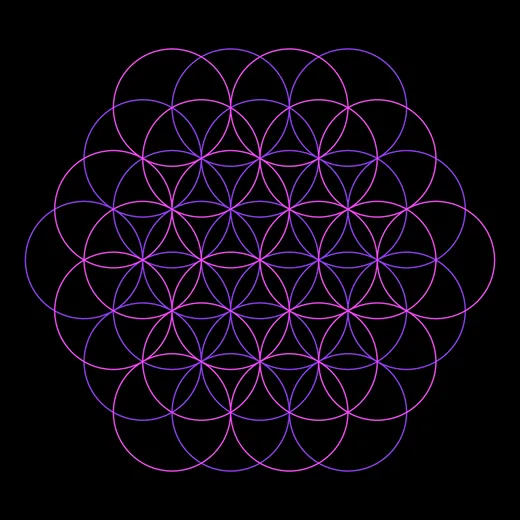
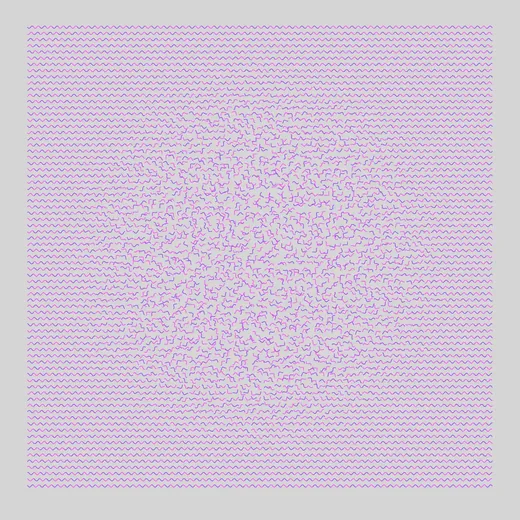
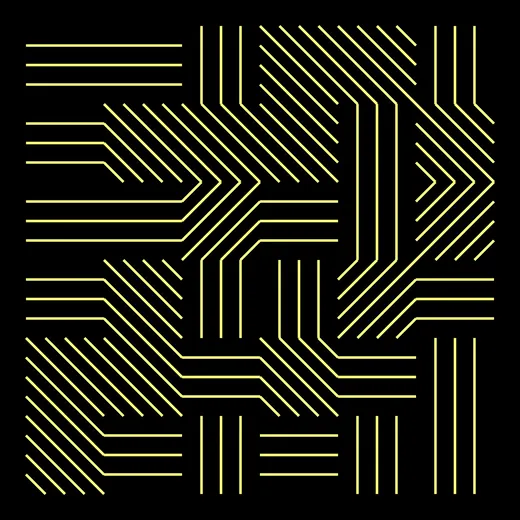
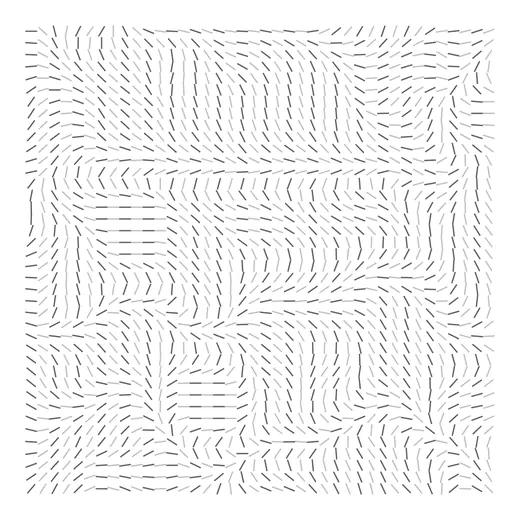
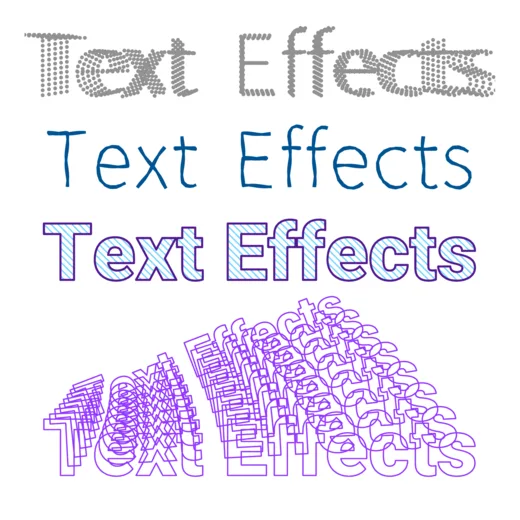
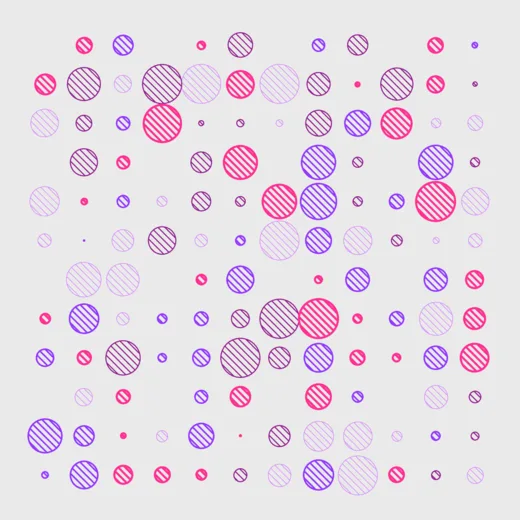
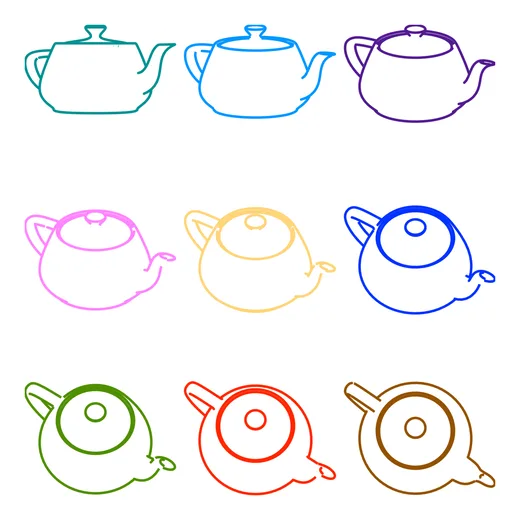
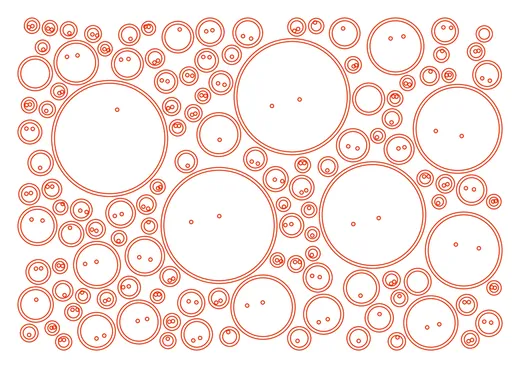
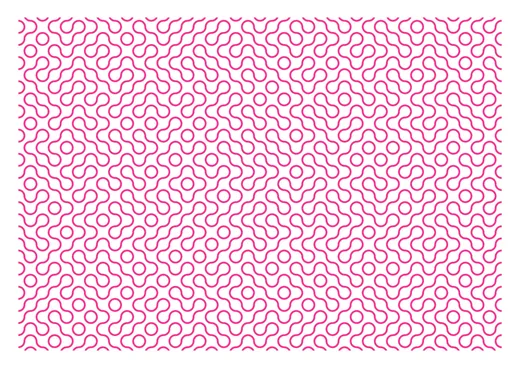
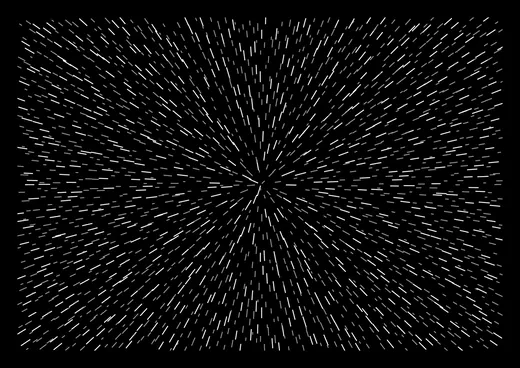
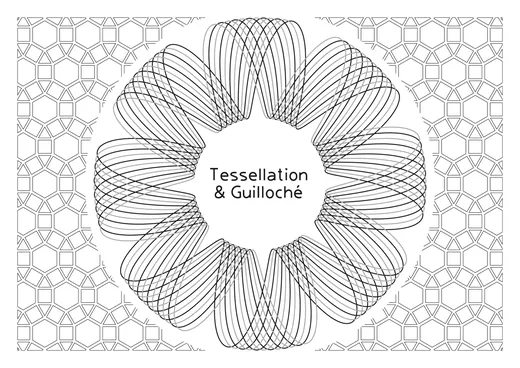
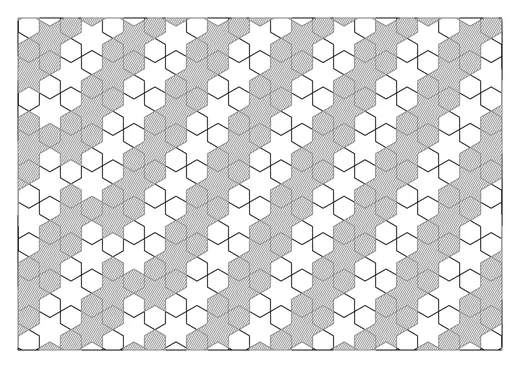
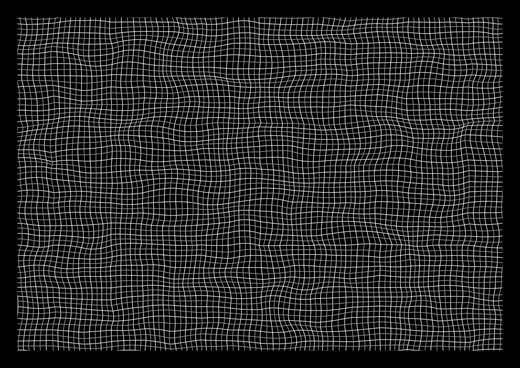
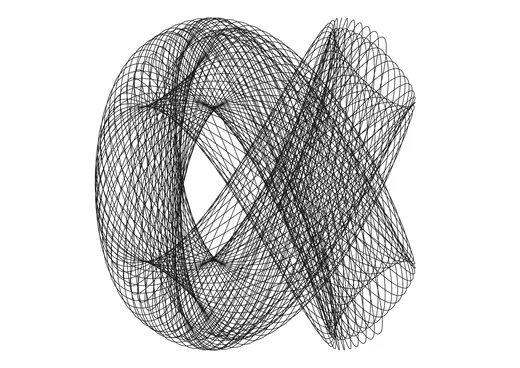
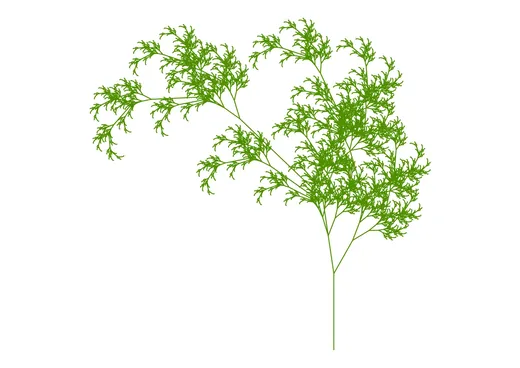
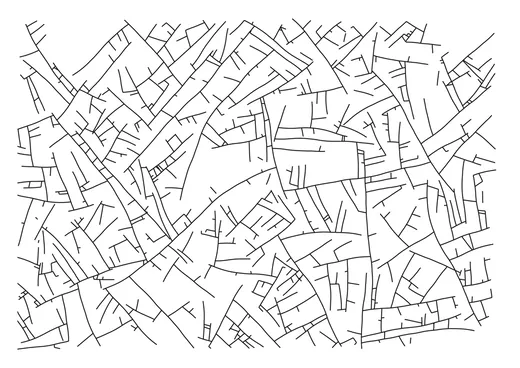
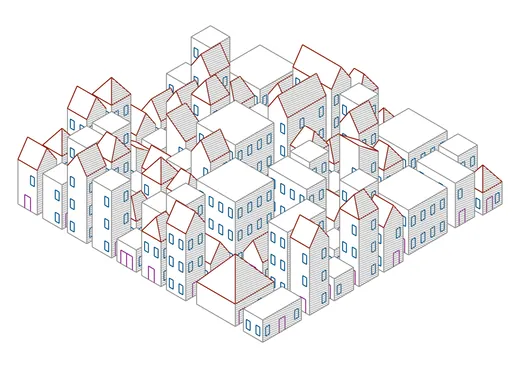
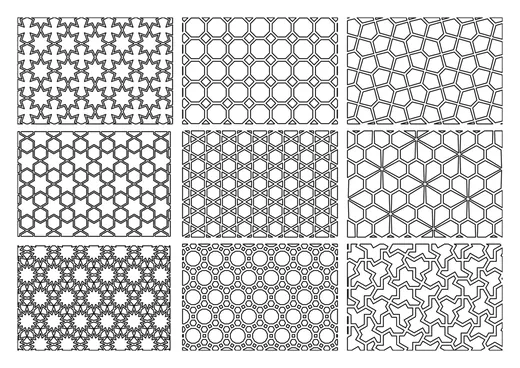
Actual plots designed and plotted from GD Studio.
How it works
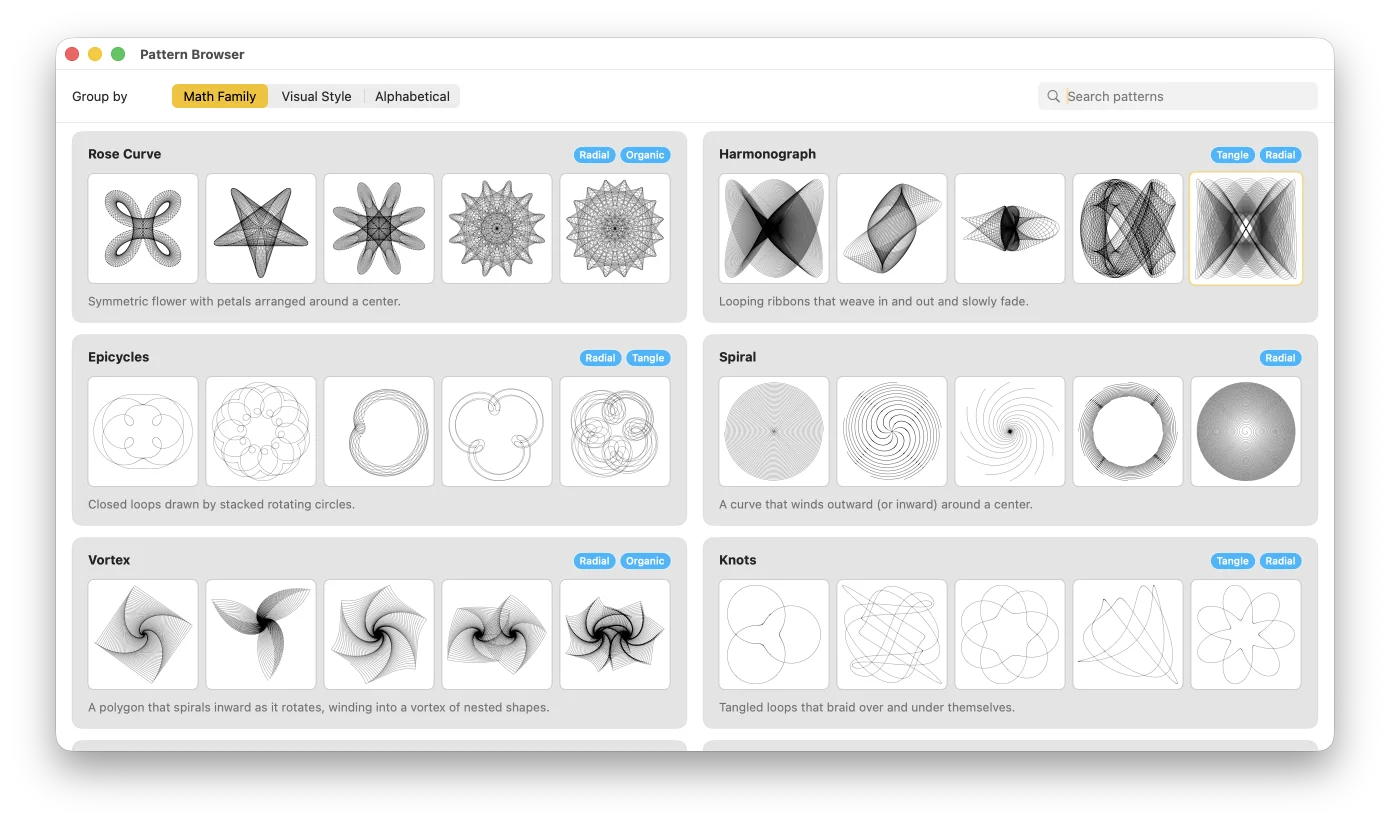
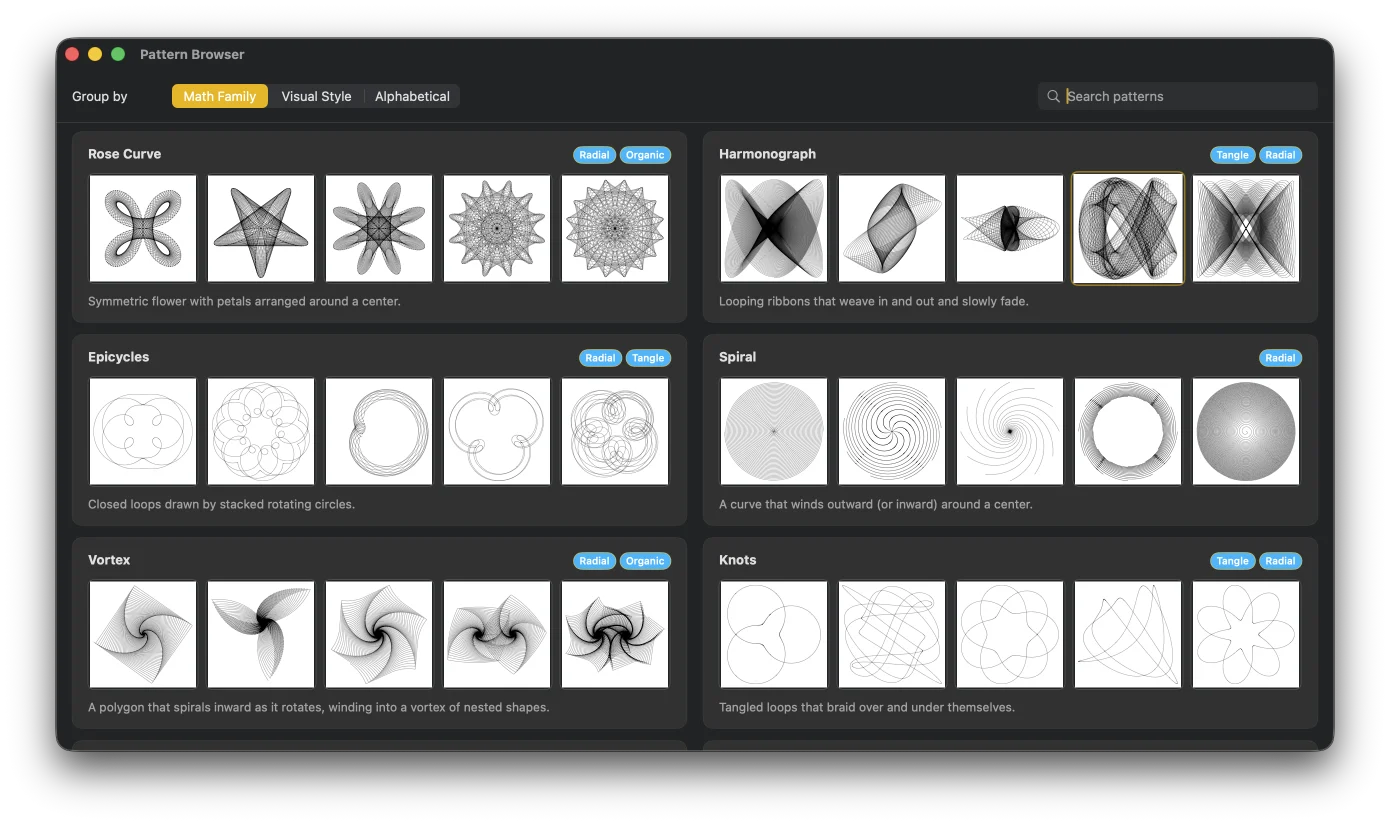
Open the welcome window and choose from the Pattern Browser, or start with your most recently used pattern.
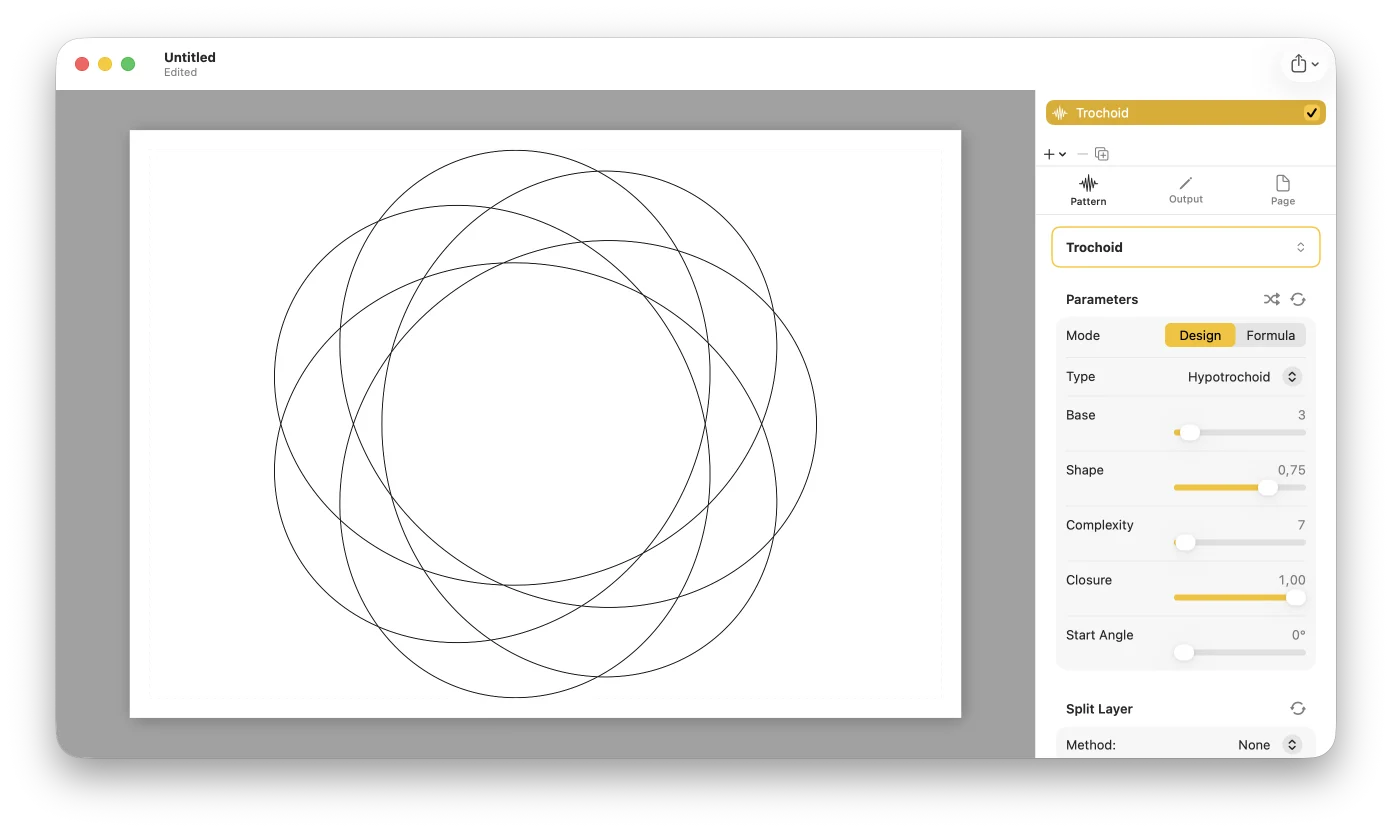
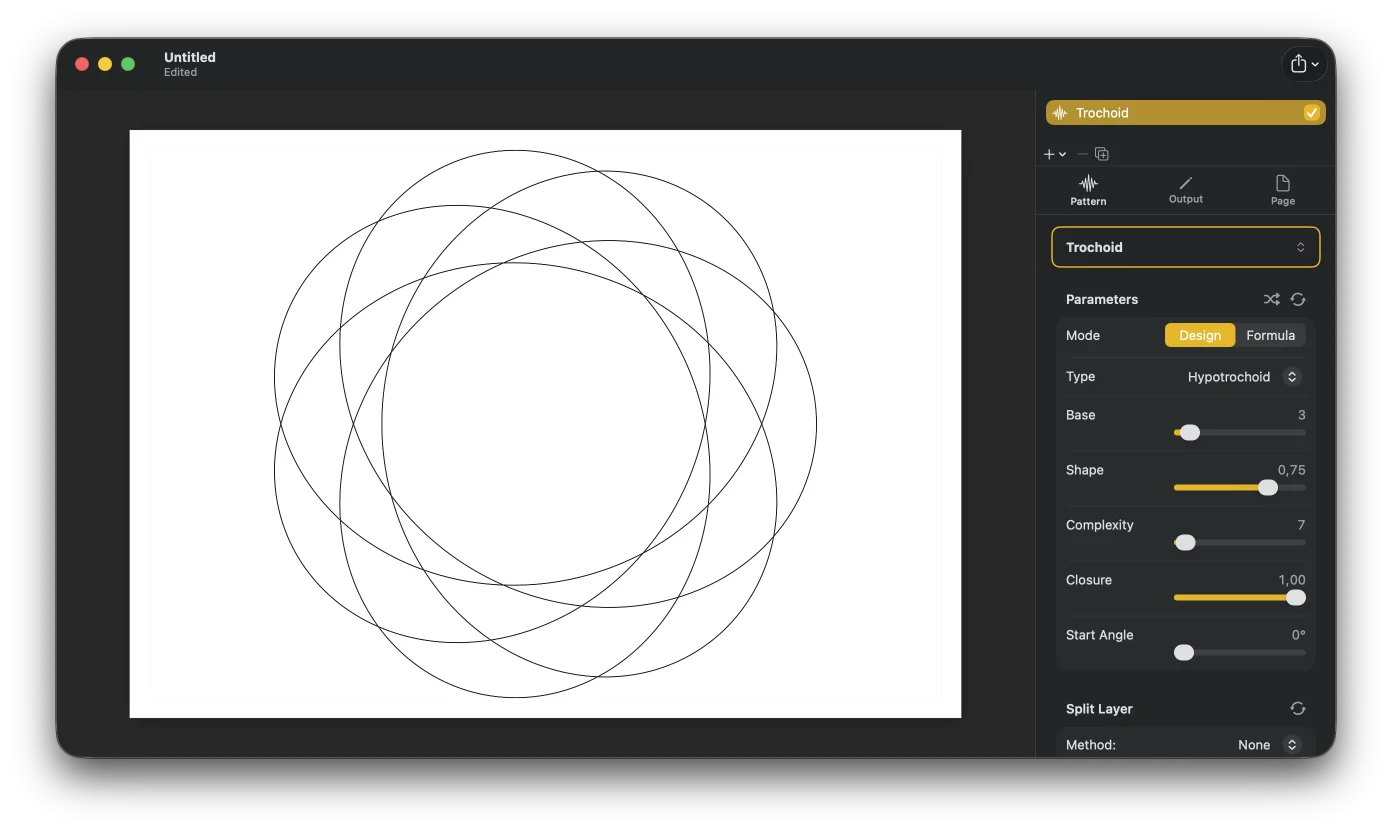
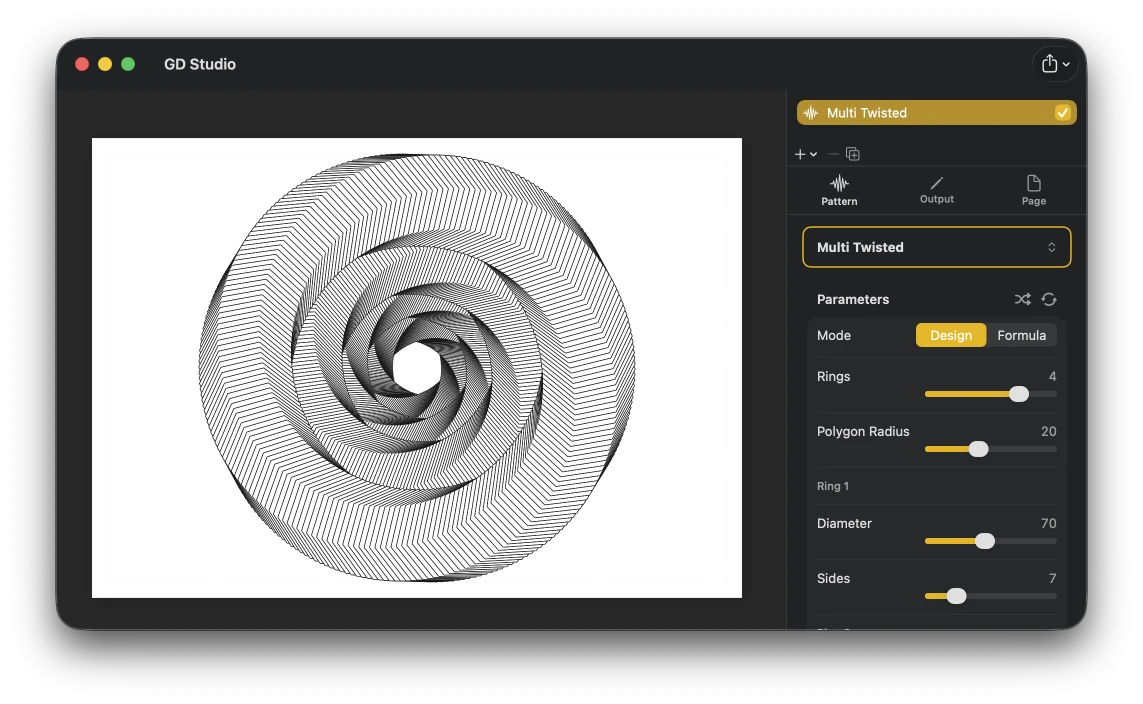
Adjust parameters in the Inspector and watch the canvas redraw instantly. Switch between Design and Formula mode for as much control as you want.
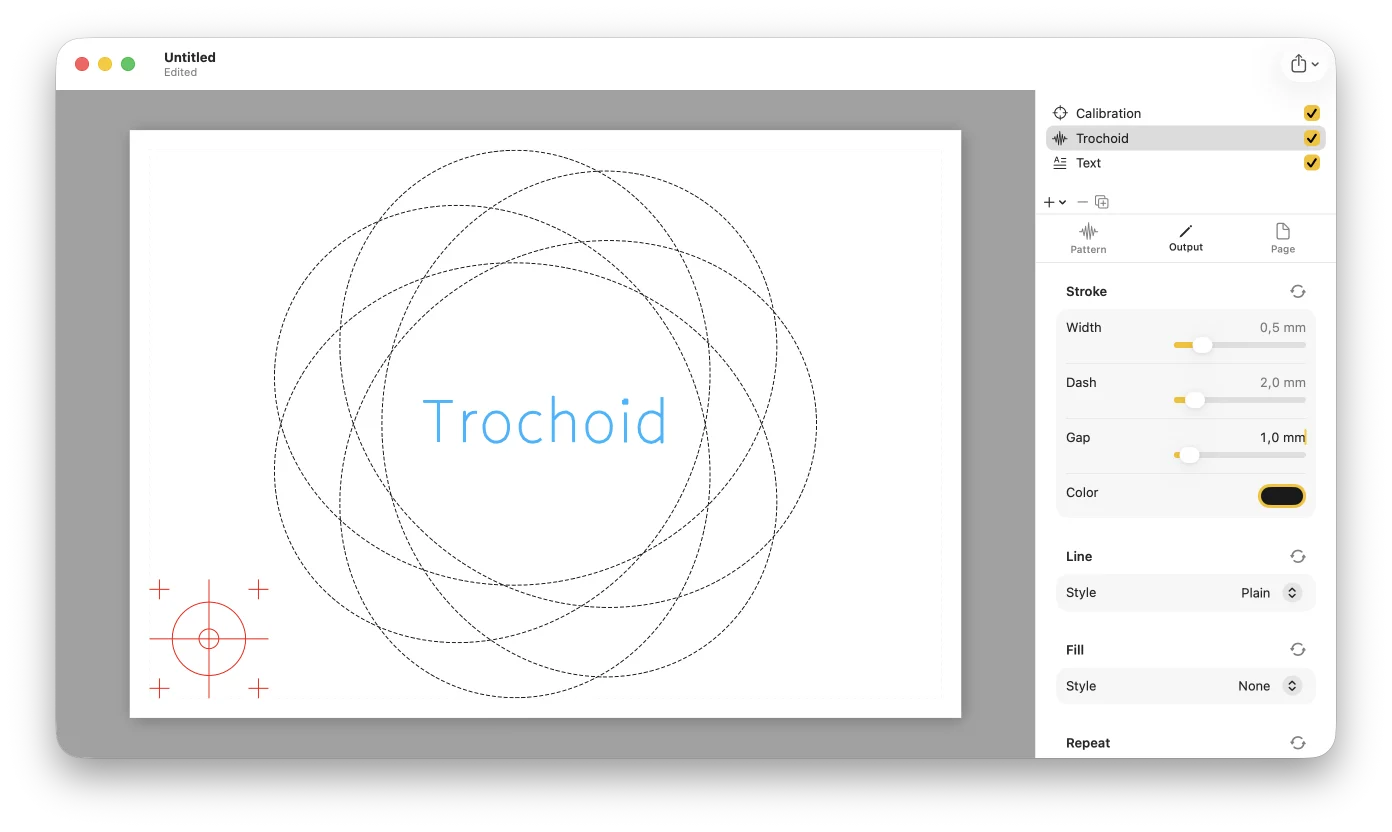
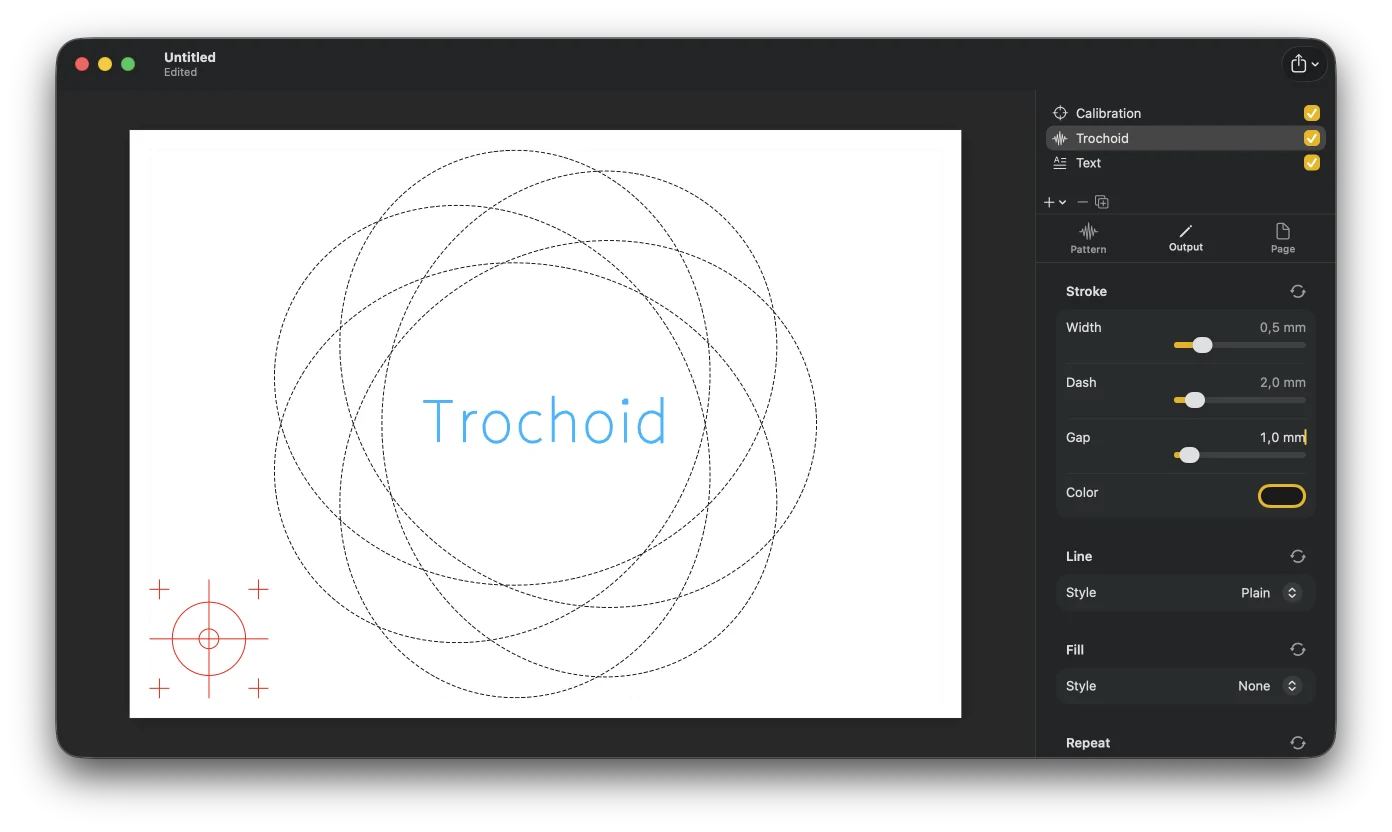
Add pattern, text, SVG, or calibration layers. Give each its own pen and render style; reorder, hide, and duplicate freely.
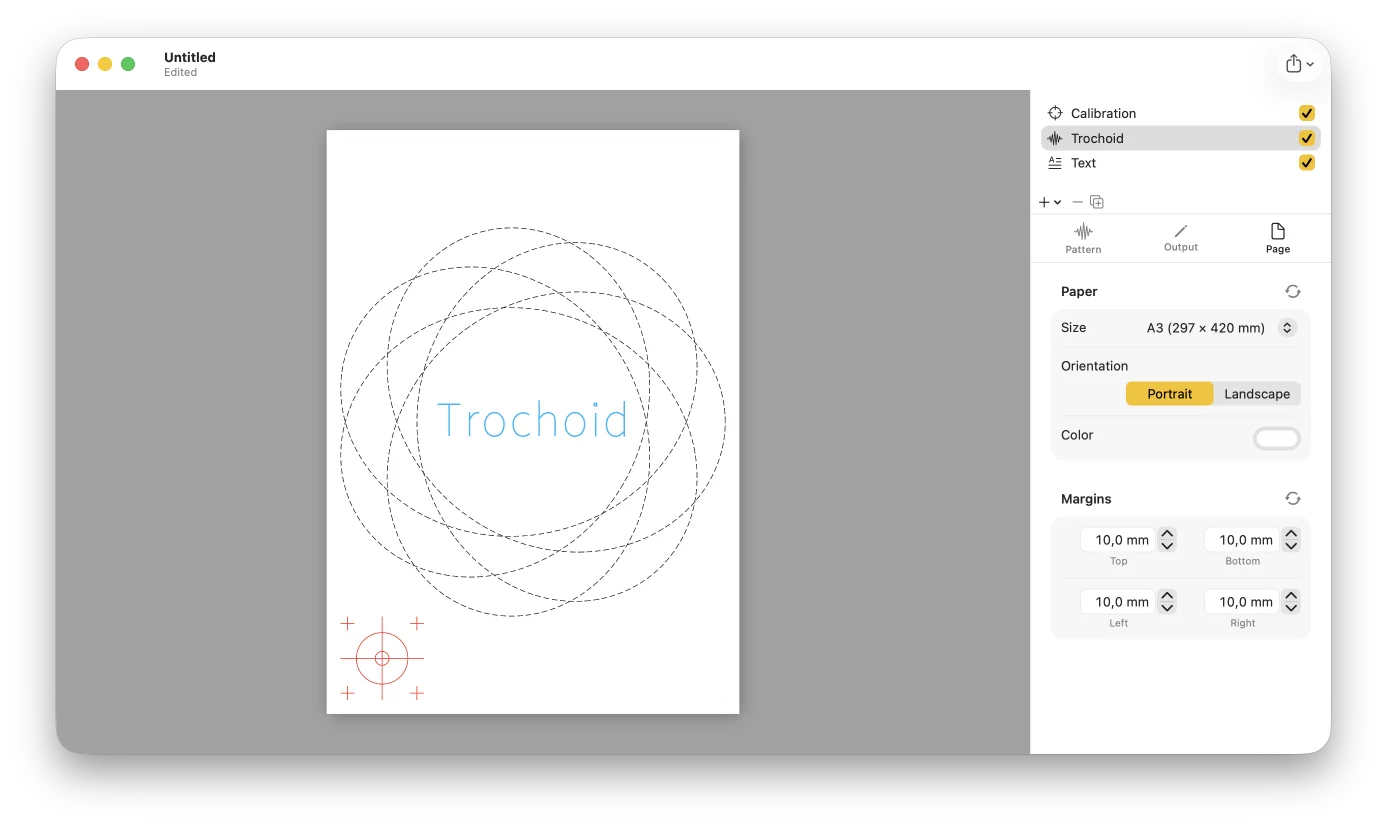
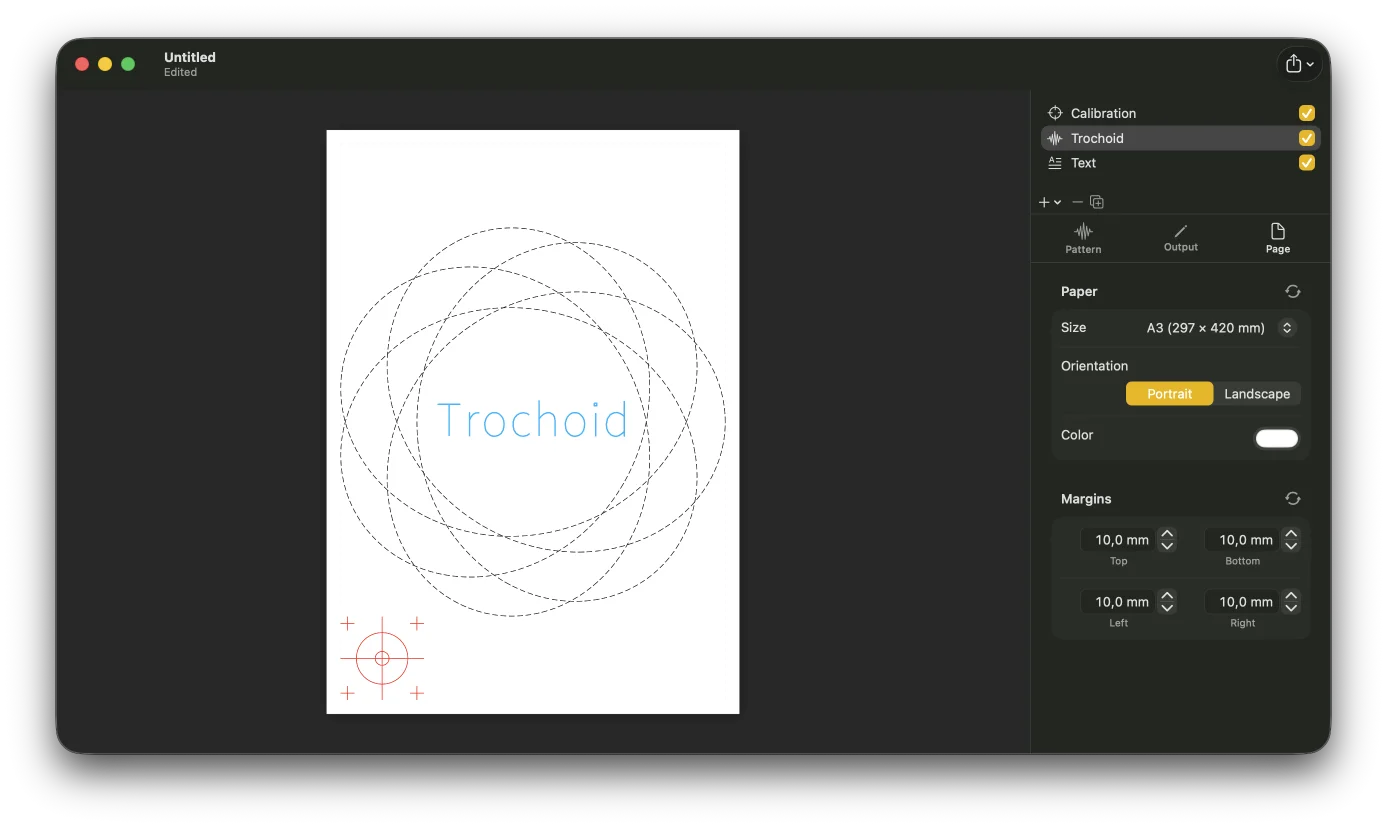
Choose paper size, orientation, and margins so the drawing fits your plotter bed.
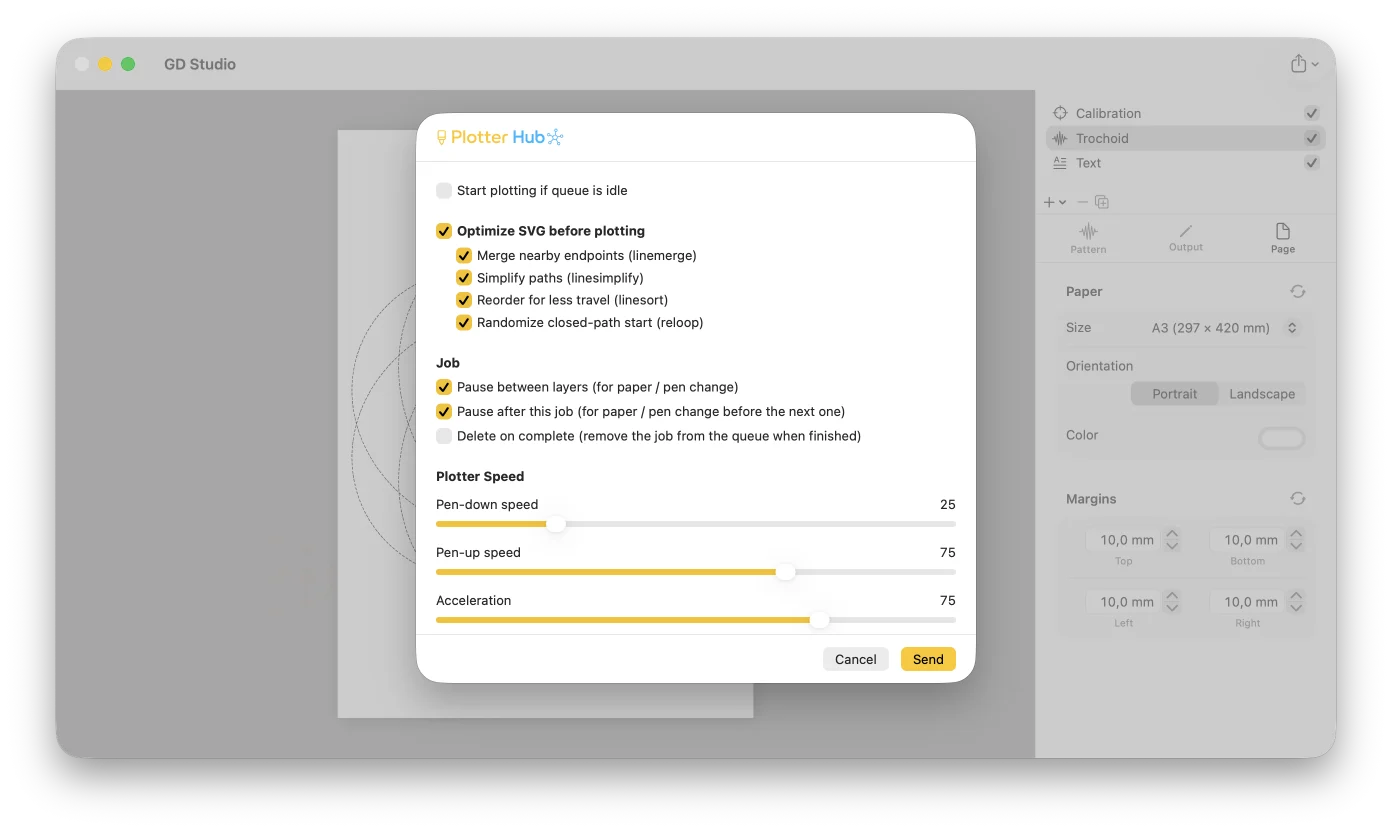
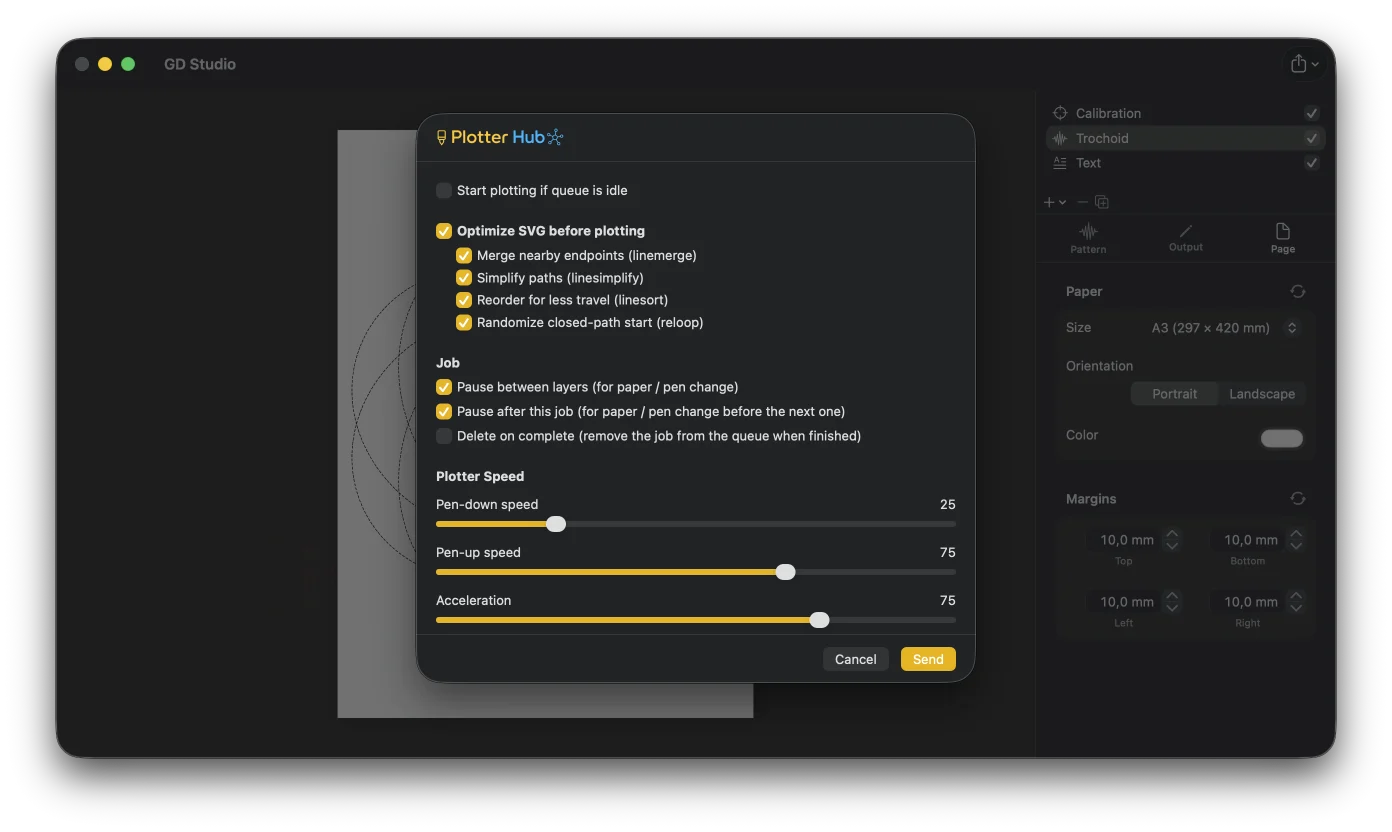
Save an SVG (one group per pen), a PDF, print, or send it to Plotter Hub. Load it in your plotter software and draw.
Made with GD Studio
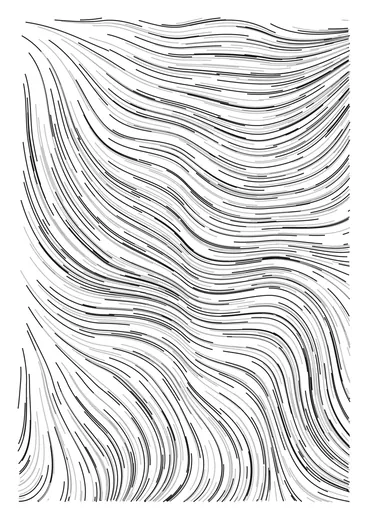
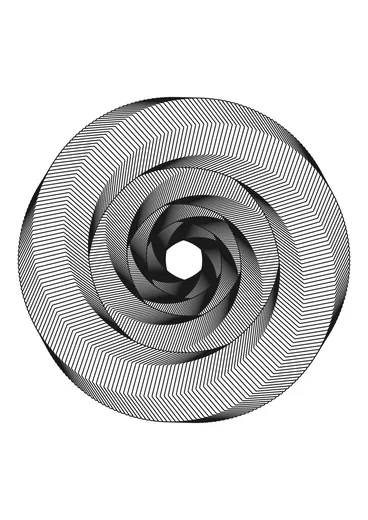
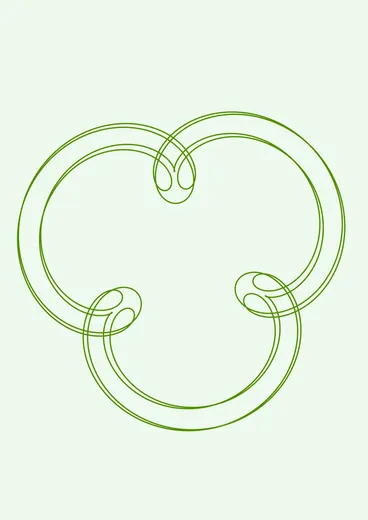
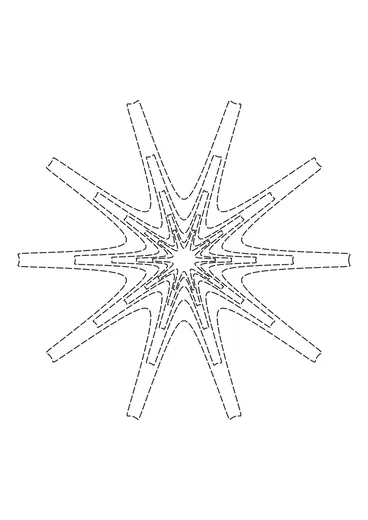
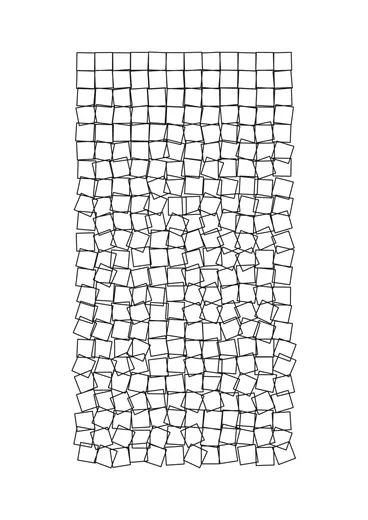
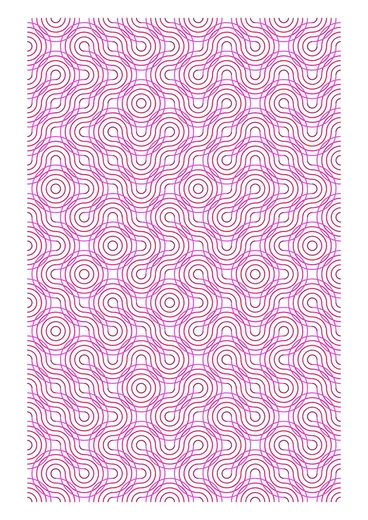
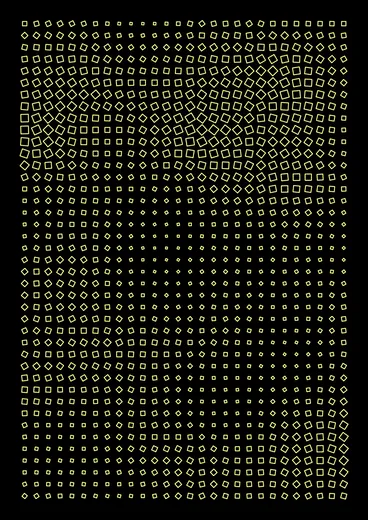
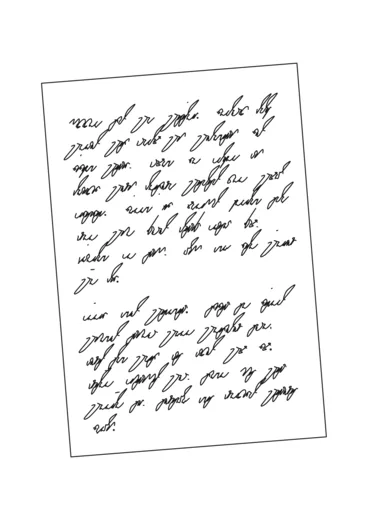
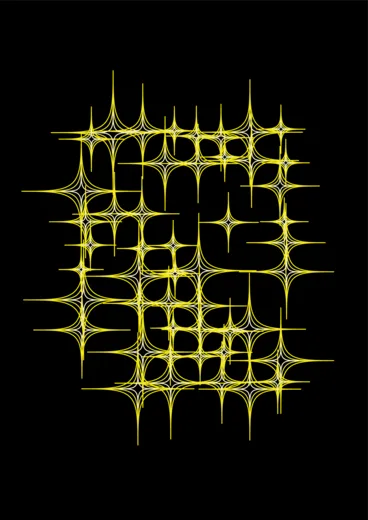
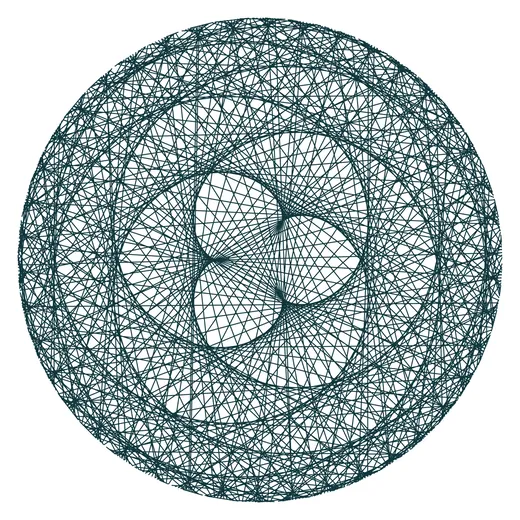
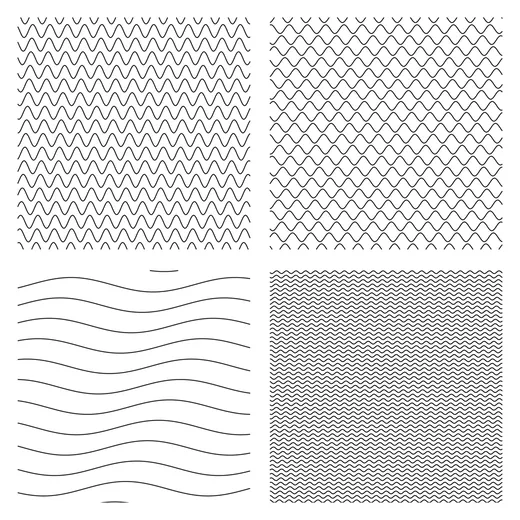
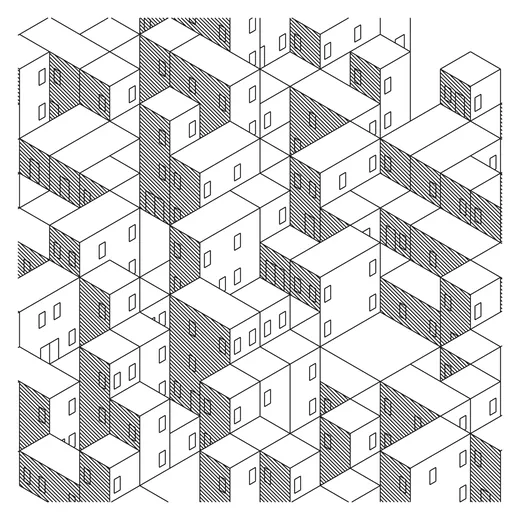
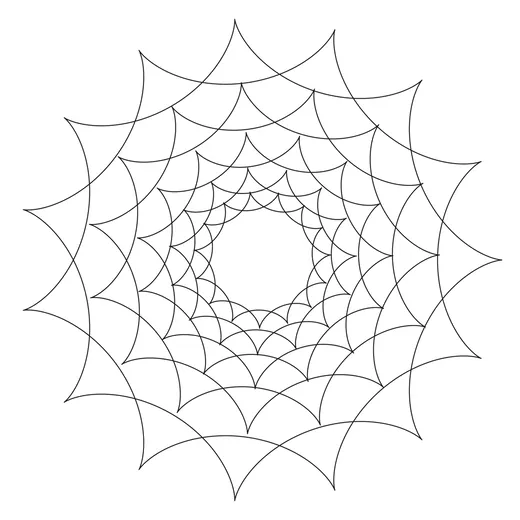
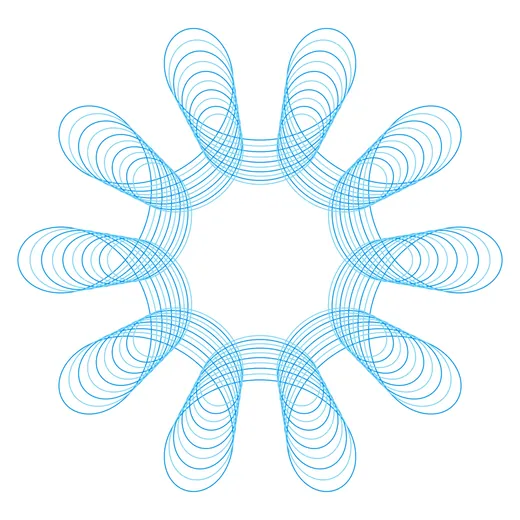
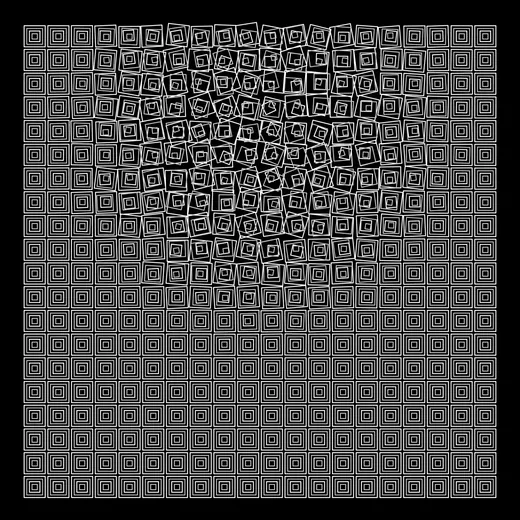
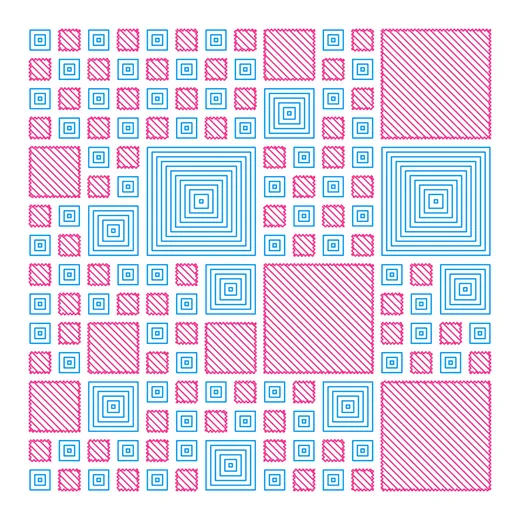
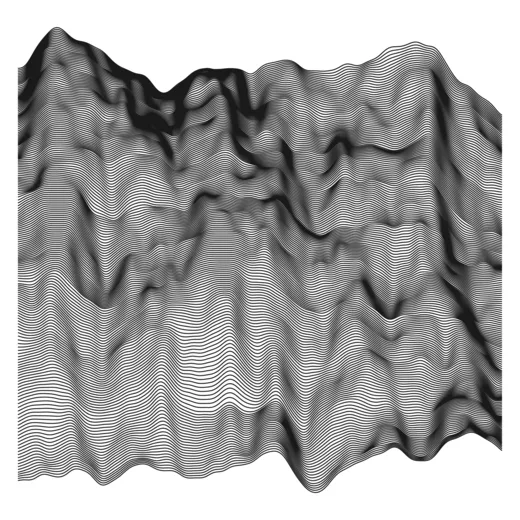
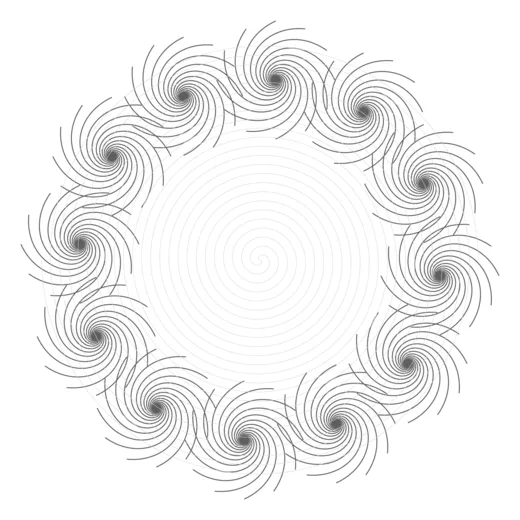
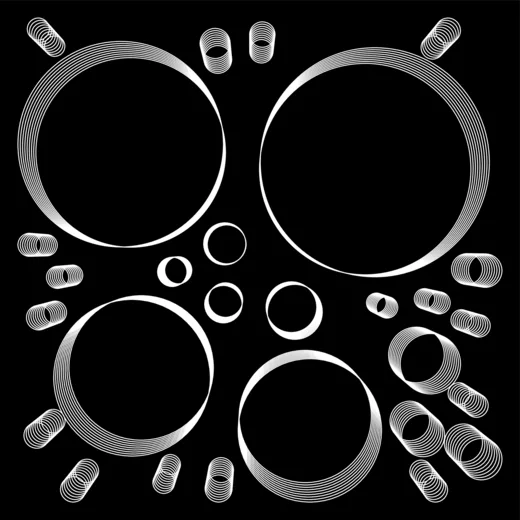
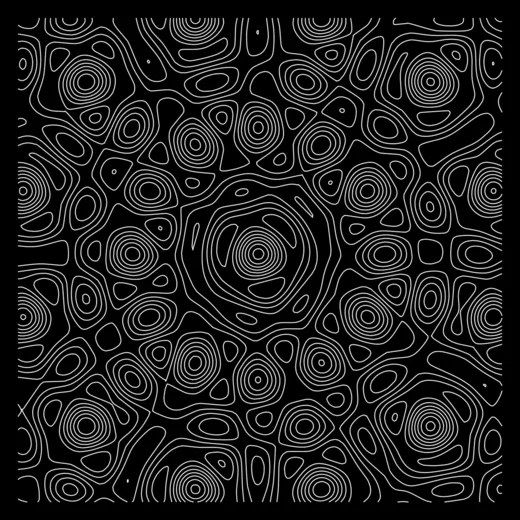
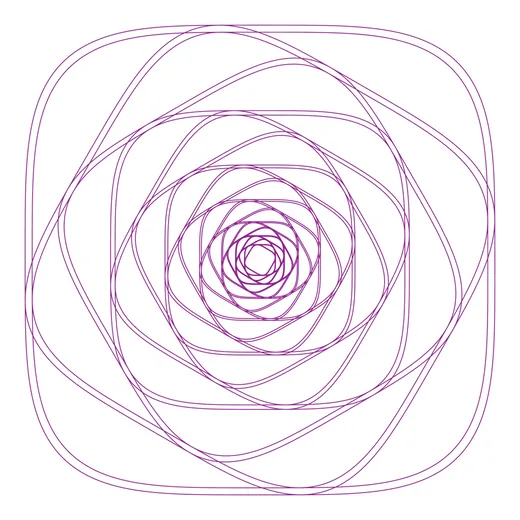
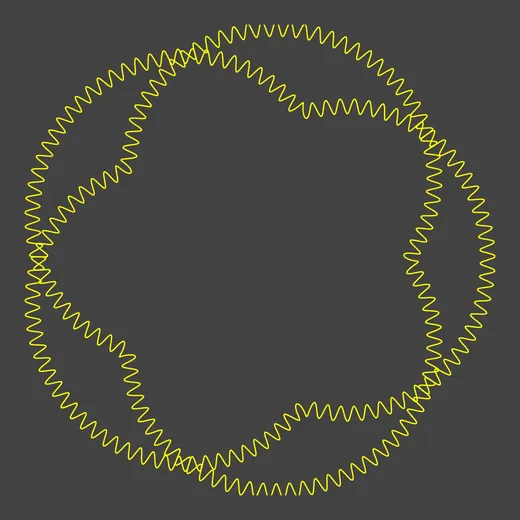
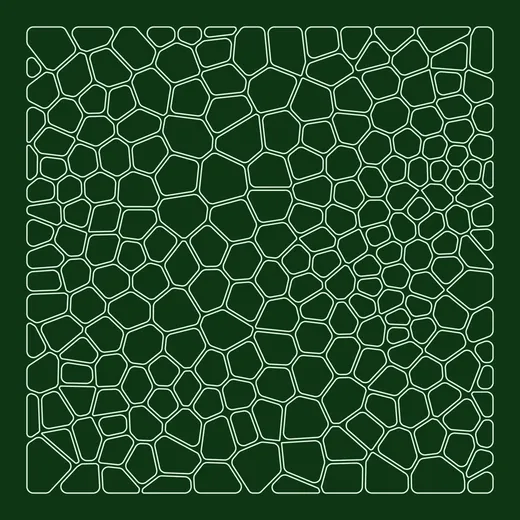
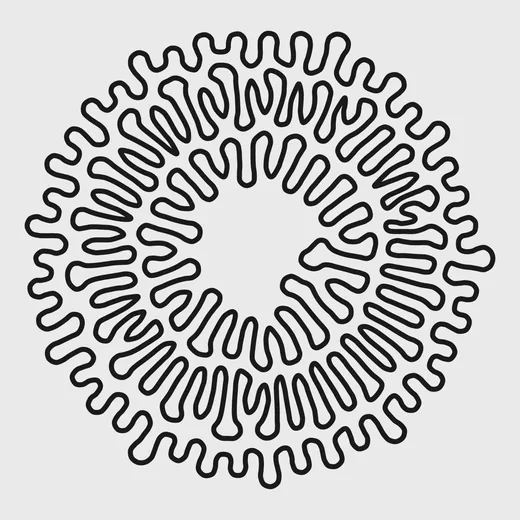
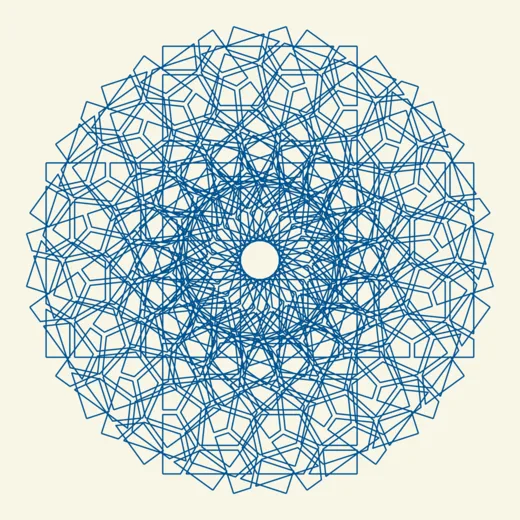
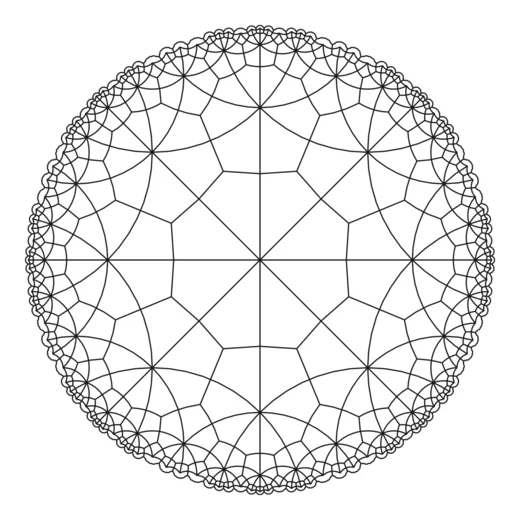
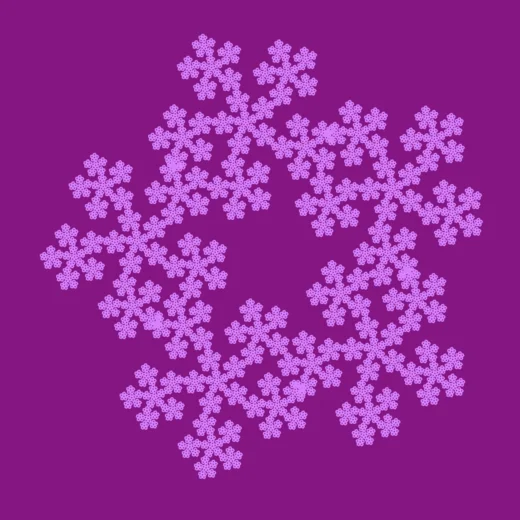
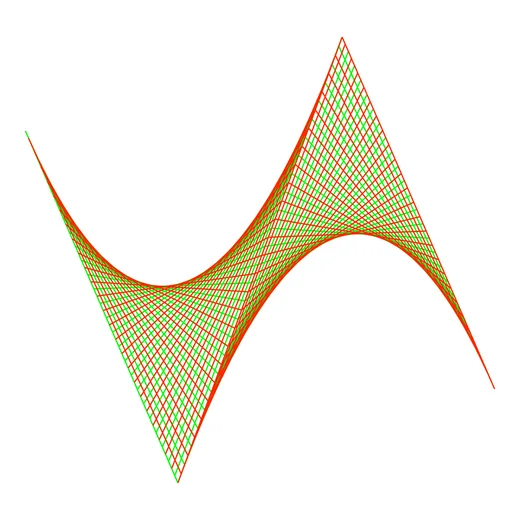
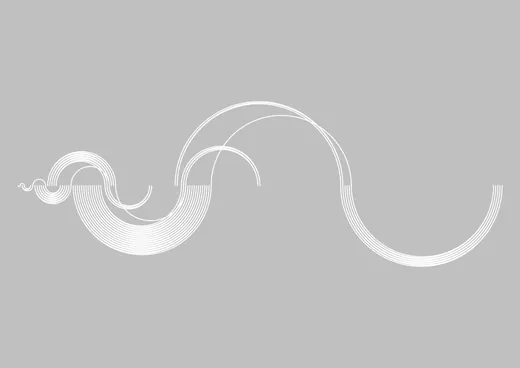
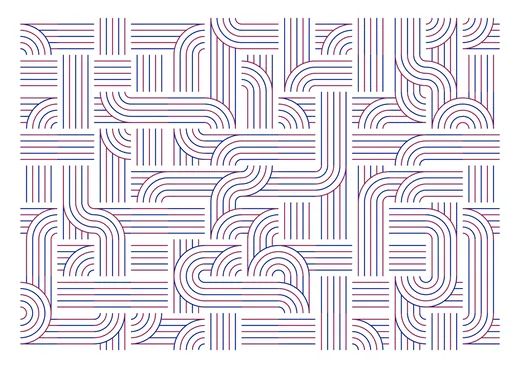
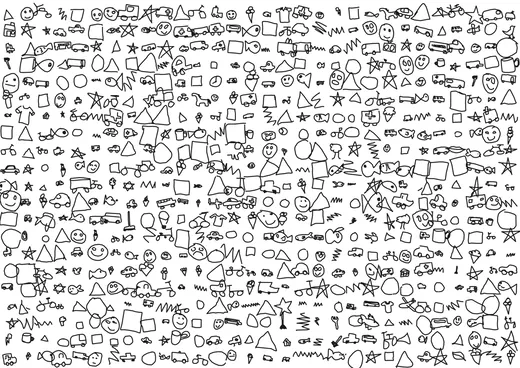
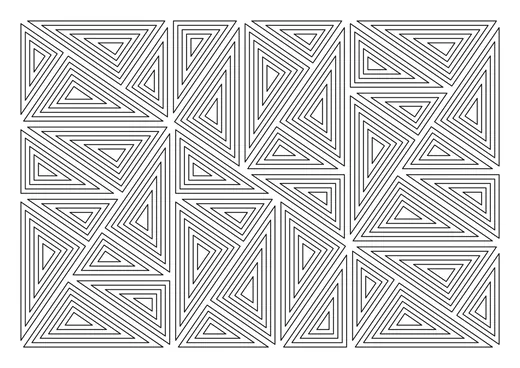
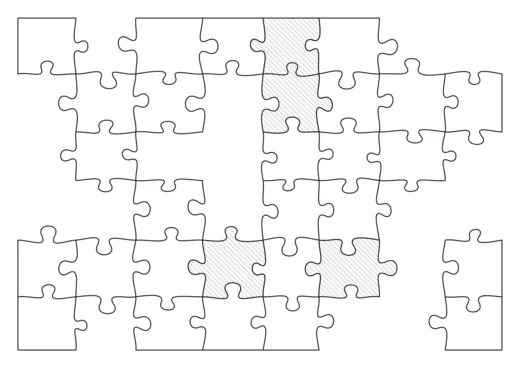
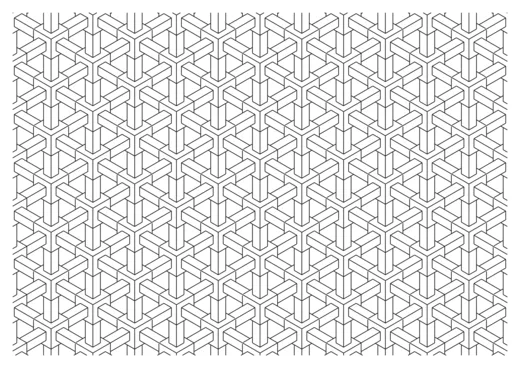
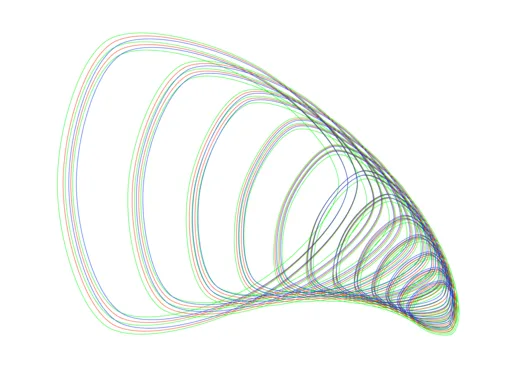
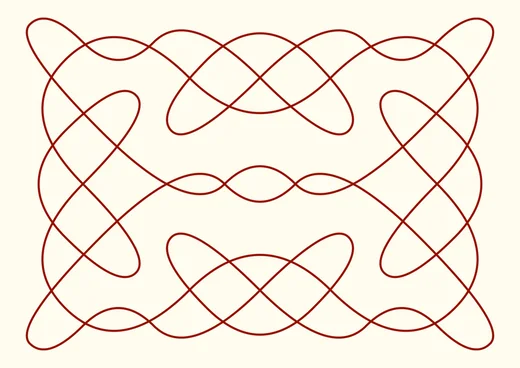
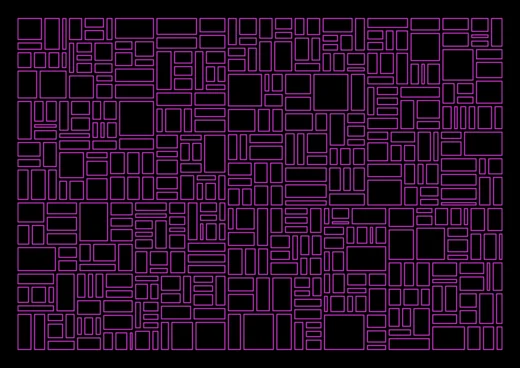
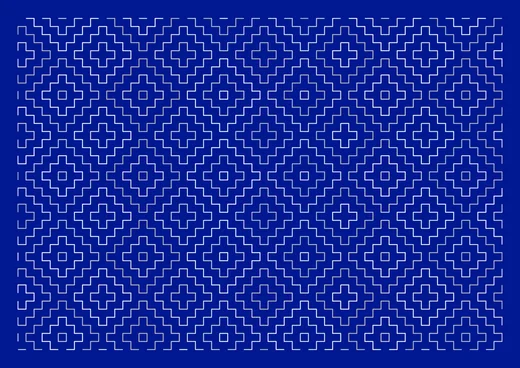
Anything can become a line drawing. Each one is a preview from GD Studio, ready to draw on a pen plotter. Click any thumbnail to view it full screen.
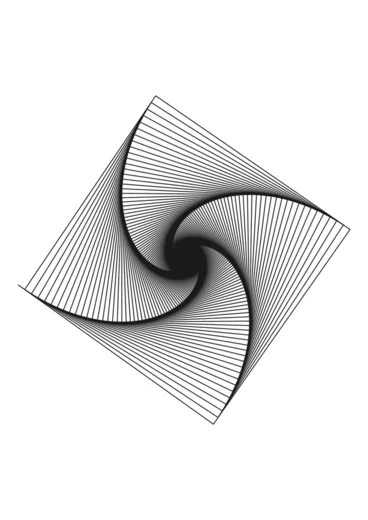
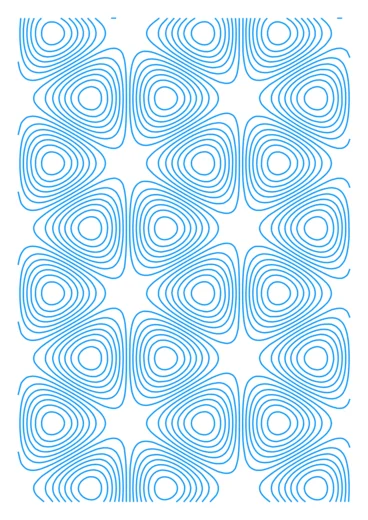
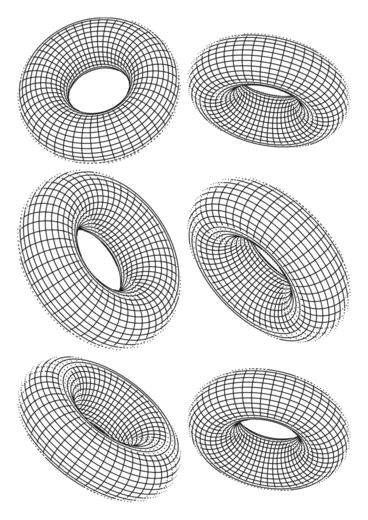
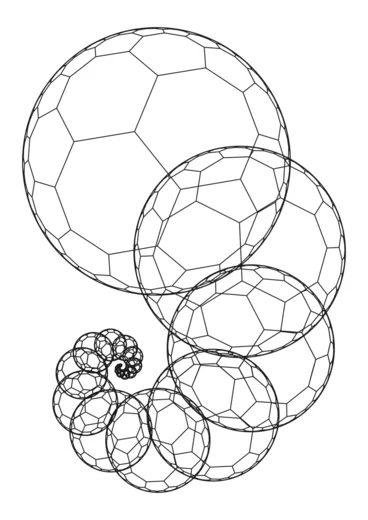
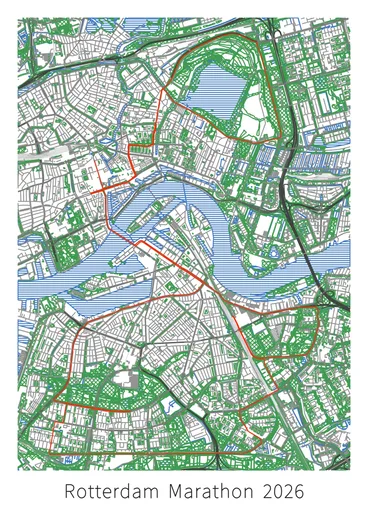
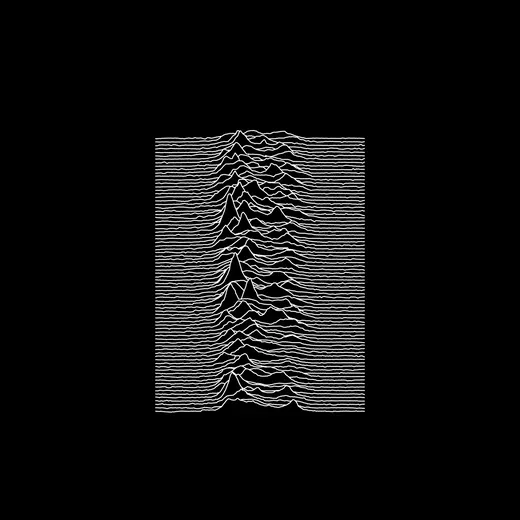
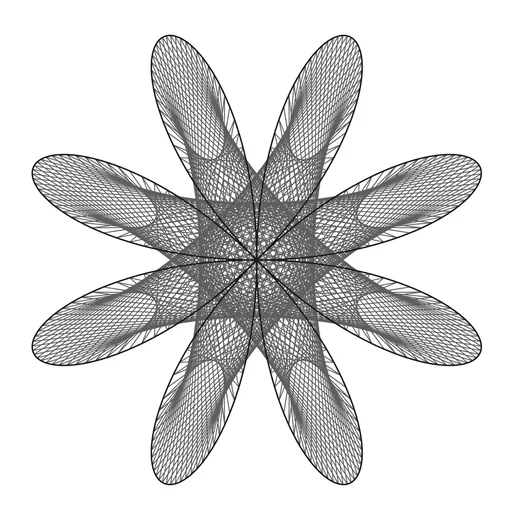
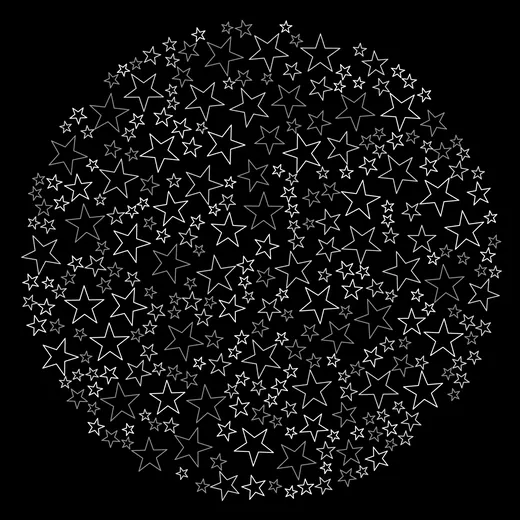
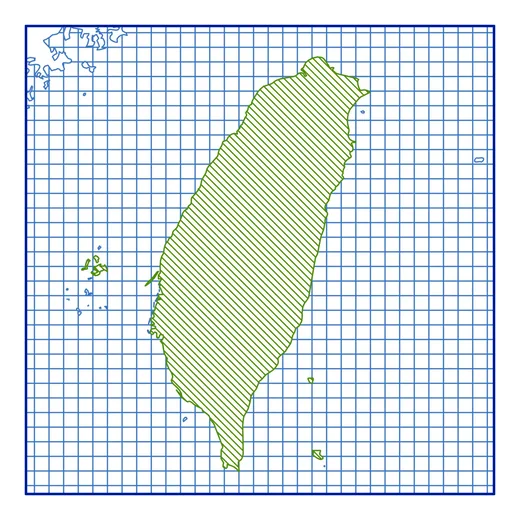
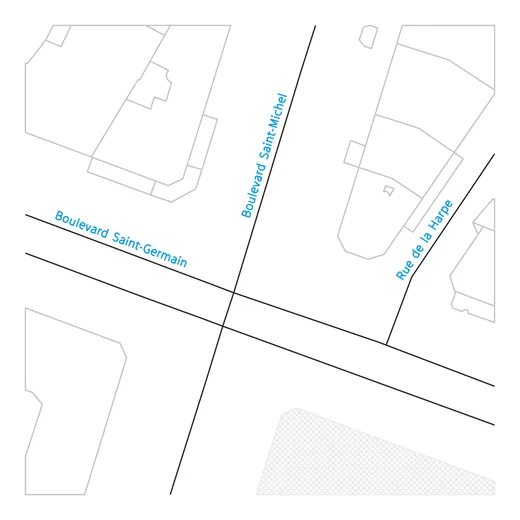
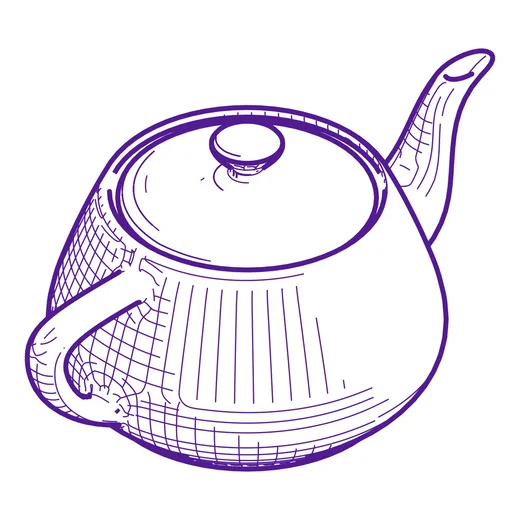
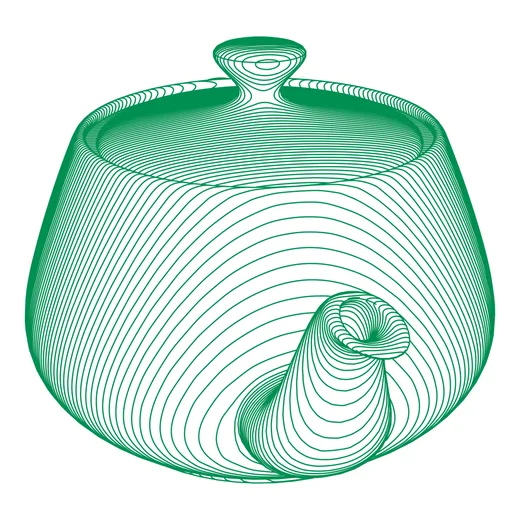
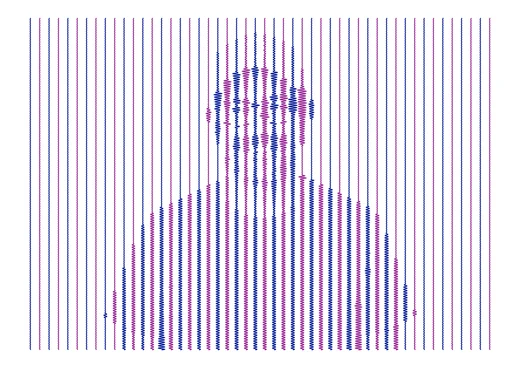
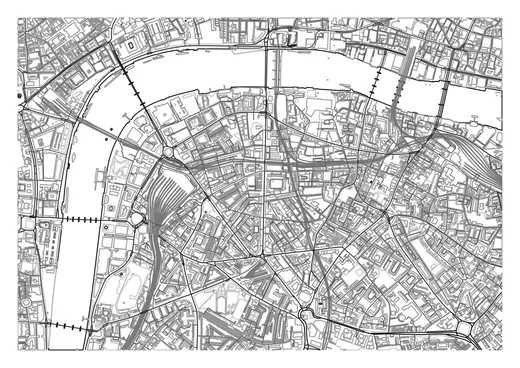
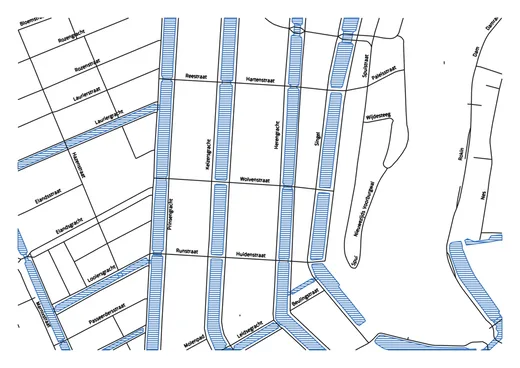
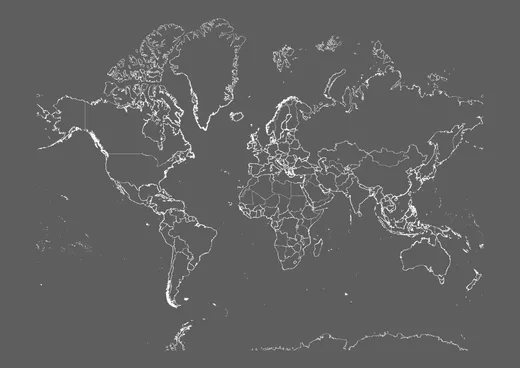
Map data © OpenStreetMap contributors, available under the Open Database License. Country, continent, and world cartography from Natural Earth (public domain).
One-Time Purchase
VAT included (except US & CA)
Secure payment via FastSpring
GD Studio FAQ
Getting Started
What's in the free trial?
What's in the free trial?
The full app with no time limit. You can open and explore all 50 patterns and tools, and save documents for every pattern. Exporting is available for Trochoid-only documents in trial mode; a license unlocks export for every pattern.
Patterns & Design
How many patterns are there?
How many patterns are there?
50 patterns, grouped into 8 families: Curves, Shapes, Points, Multi-line, Tilings, Grids & Packing, Generative Systems, and Simulation. Many patterns also include several built-in Types — each a distinctly different design — multiplying the number of variations several times over. Each pattern ships with curated presets, and fine-grained sliders make the practical variety effectively unlimited.
What's the difference between Design mode and Formula mode?
What's the difference between Design mode and Formula mode?
Design mode gives you high-level controls; Formula mode exposes the underlying mathematical parameters for full control. Simpler patterns show a single set of controls.
Can I randomize or start from a preset?
Can I randomize or start from a preset?
Yes — every pattern includes curated presets, plus shuffle and reset controls.
Plotters & Export
Which plotters does GD Studio work with?
Which plotters does GD Studio work with?
Any plotter that accepts SVG. GD Studio exports one labeled group per layer (Inkscape / axicli convention), so axicli, vpype, and Inkscape's plotter extensions can route each layer to its own pen. AxiDraw-class plotters are also supported directly via Plotter Hub.
How do I assign different pens to different parts of a drawing?
How do I assign different pens to different parts of a drawing?
Put each pen's content on its own layer — each layer carries its own pen color, stroke width, and dash, and exports as a separate group. To split one pattern across pens, use the Split section of the Pattern tab (by path length, tile orientation, spiral arm, contour level, and more).
What can I export?
What can I export?
SVG, PDF, and direct printing, plus sending straight to a plotter over your local network with Plotter Hub.
Why does my exported SVG look different from the canvas?
Why does my exported SVG look different from the canvas?
Hidden layers are excluded, the page background isn't plotted (it's written as a CSS background that viewers show but plotters ignore — PDF export bakes it in), and the viewport is the drawable area, so anything outside the margins is clipped.
Maps
Can I draw a map?
Can I draw a map?
Yes. Add a Map layer and pick a scale: search for a city or area to get street-level detail, or choose a country, continent, or the whole world. Every feature is an independent toggle — motorways down to footpaths, railways, rivers, coastline, water, parks, buildings, and boundaries — so you compose exactly the map you want.
Where does the map data come from?
Where does the map data come from?
Street-level detail comes from OpenStreetMap (© OpenStreetMap contributors, ODbL); country, continent, and world scales use Natural Earth's public-domain cartography. A first fetch needs an internet connection, and because OpenStreetMap's Overpass service is a free public one, very large areas can take a while. The geometry is then stored inside your document, so a saved map reopens offline and plots identically every time — it's captured, not re-fetched.
Can I put my own route on a map?
Can I put my own route on a map?
Yes — import GPX tracks (a run, a ride, a race route) and they're drawn on top of the map. Import several at once, either merged into one layer or split into one layer per route.
Can I plot a map in multiple colors?
Can I plot a map in multiple colors?
Yes — Split by Map Feature puts each feature class (roads, water, parks…) or each GPX route on its own layer with its own pen, ready for a multi-pen plot. Each layer starts from a cartographic default — water, for example, in blue with a parallel-line fill — and every pen, color, and fill is yours to change from there. Closed areas are hatched rather than flooded, since a pen can't fill.
Can I label the streets?
Can I label the streets?
Yes — street and area names can be turned into editable Text layers, grouped by category. Each label becomes its own text item you can move, resize, or rename on the canvas.
3D Models
Can I plot a 3D model?
Can I plot a 3D model?
Yes. Add a 3D Model layer and import an OBJ, STL, or PLY mesh — or start a whole document from a model. GD Studio turns the mesh into pen strokes rather than a shaded render, so the canvas shows exactly what the pen will draw. The model is embedded in the document, so a saved file reopens and plots on any machine without the original asset. If a file uses a different up-axis convention, an override stands it upright, and Replace swaps in a different mesh while keeping the layer's position, size, and all its settings. Large meshes parse in the background, so you'll see a brief loading badge before the drawing appears.
Can I choose the camera angle and projection?
Can I choose the camera angle and projection?
Yes — azimuth, elevation, and roll aim the camera anywhere on the sphere around the object. Four projections are available: Orthographic for a measurable technical view, Isometric at a fixed 30°, Oblique for a true front face with sheared depth (adjustable angle and depth scale, so cabinet and cavalier are both covered), and Perspective with an adjustable focal length. In Perspective, lens shift X/Y moves the camera eye sideways or vertically without rotating it — true two-point architectural perspective that keeps vertical edges vertical.
Which lines of a 3D model does GD Studio draw?
Which lines of a 3D model does GD Studio draw?
Hidden-line removal: surfaces occlude whatever sits behind them, so you get a solid object rather than a see-through wireframe. You can switch it off for an x-ray look. A mesh detail slider then sets how much of the geometry is drawn — from just the essentials (silhouette, open edges, and sharp feature edges) through progressively flatter folds, up to the full triangle wireframe.
What shading styles are there for 3D models?
What shading styles are there for 3D models?
Eight, each filling the surface with descriptive strokes instead of a flat fill. Hatch is parallel tonal hatching from a light source; Engraving cuts tonal lines along the model's own axes to wrap the form; Copperplate follows the surface's natural curvature, with a second cross-hatch family filling the shadows for a true engraved gradient; Contours are topographic slice lines, with an optional cross-axis second set; Helix winds that same slicing into one continuous spiral for a lathe-turned look; Bands draws isophotes, or lines of equal illumination; Hachures are cartographic slope hachures, denser on steep faces; and Rim echoes the visible silhouette with offset lines, dense where the surface turns away. Light-driven styles expose light direction and height, and all of them offer spacing in millimeters on paper, density, level count, and smoothing. Three overlay modifiers can be layered on top: depth cue for atmospheric fade, cast shadows for self-shadowing, and a hatched ground shadow on an imaginary floor.
Can I cut a model open?
Can I cut a model open?
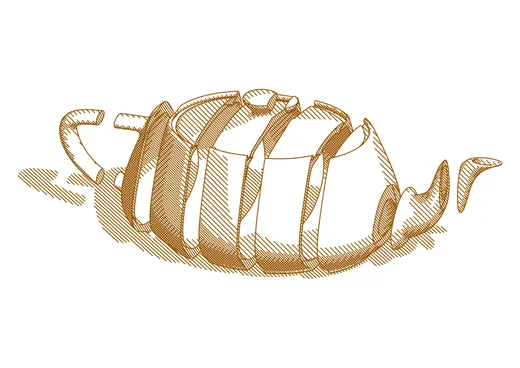
Yes, and the cut applies to edges, shading, and shadows alike. Cross-Section keeps one half and hatches the exposed cut face, with axis, offset to slide the plane end to end, and flip controls. Slices cuts the whole model into equal slabs fanned out along an axis — set the slice count and the spacing, where zero reassembles it back into a solid — and each slab casts its own shadow. Section fill density and two tilt controls let you skew the cut plane off its axis for arbitrary oblique cuts across all three axes.
Can I plot a 3D model in multiple colors?
Can I plot a 3D model in multiple colors?
Yes — split the model into ordinary pen layers by shading (line work versus shading and shadows), detail (silhouette versus fine feature and mesh lines), hidden lines (their own layer, so you can dash them), depth (front-to-back bands), tone (hatching tones across pens), or slice (each slab to its own layer). After the split the model layer is replaced by regular layers, so you can recolor, restyle, or delete any of them like anything else in the document.
Images
Can I turn a photo into line art?
Can I turn a photo into line art?
Yes. Add an Image layer, drop in a photo (from a file or your Photos library), and pick a conversion style. GD Studio reads the picture's light and dark and rebuilds it from continuous pen strokes and single pen-taps — never a flat ink fill — so the preview matches exactly what the pen draws. Brightness and Contrast sliders shape how the subject reads. Eight styles are available: Stipple, Halftone, Hatch, Contour, Outline, Sketch, Squiggle, and ASCII.
Can I make a multi-color plot from a photo?
Can I make a multi-color plot from a photo?
Yes — a color split separates the photo into one pen layer per color (faithful Natural, punchy Vivid, or Tonal light-to-dark), so you can swap pens and build up a true multi-color plot. It works with every style.
Text, SVG & Calibration
Can I add text?
Can I add text?
Yes — text is rendered as true plotter strokes, using single-stroke and outline fonts.
Can I use my own fonts?
Can I use my own fonts?
Yes — add your own custom SVG fonts in Settings and use them in any text layer.
Can I import my own SVG files?
Can I import my own SVG files?
Yes. Add an SVG layer and its lines become the layer's path; you can then restyle those lines with any pen and render style, mask them, or transform them like any other layer.
What's the calibration layer for?
What's the calibration layer for?
A crosshair for pen registration and plotter calibration.
Settings & Defaults
Can I change the measurement unit?
Can I change the measurement unit?
Yes — choose millimeters, centimeters, or inches in Settings. Every length input across the app follows your choice. It's a display preference only; documents always store dimensions in millimeters, so switching units never changes how a saved drawing measures on paper.
Can I set my own defaults?
Can I set my own defaults?
Yes. In Settings you can manage the paper-size list — including adding your own custom sizes — and set the defaults a new document inherits: paper size, orientation, background color, and margins. You can do the same for stroke defaults (line width) and for fonts, including importing custom SVG fonts and choosing the default font and height.
Can I control the output resolution?
Can I control the output resolution?
Yes. A render-resolution setting controls how closely each curve is followed when it's flattened into plotter segments — from ultra-fine (0.025 mm) for tiny details to draft (0.5 mm) for quick proofs. Lower values give smoother strokes at the cost of larger files and slower exports.
Privacy
Does GD Studio send my work anywhere?
Does GD Studio send my work anywhere?
No. It runs entirely on your Mac. The only network traffic is opt-in: sending to a Plotter Hub server you configured (usually a Raspberry Pi on your own network), fetching map data if you add a Map layer (the area you ask for goes to the public OpenStreetMap and Natural Earth services — you can point this at your own map servers instead), and, if enabled, checking for app updates. Documents, layer content, and pattern parameters never leave your machine.